
One of the features we added recently is drawing realistic looking Conductor lines between towers on our Grid projects.
Prior to VentusAR 5.4 we drew straight lines between the connector points on the tower models. This had the effect of fairly unrealistic looking conductor lines as even across the shortest distance the conductor lines sag slightly due to gravity.
This post shows some examples of the line sag development and adds some more detail on how the line sag is calculated.
Catenary Formula
The line sag formula we use when displaying the conductor lines on a transmission project is based on a generalisation of the catenary formula. To calculate the sag at a given point we use the following formula:

Where:
- a is half the distance between towers (in meters)
- y is the drop at that point in the conductor (in meters)
Maths Example
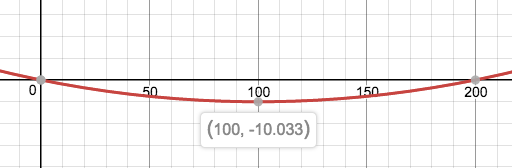
Lets take a worked example, if the towers were 200m apart, then the variable a would be 100. We can calculate the value at three sample points:
- at x = 0 the sag due is calculated as 0m – which would make sense – it is at the top of the tower
- at x = 200 the sag is calculated as 0m – it also makes sense as it at the top of the other tower
- at x= 100, the sag calculated is 10.033m – this is the bottom of the catenary curve
This is easiest shown with a graph. Below is a screenshot (with slight optical illusion):
Visual Example
When drawing the line sag, we calculate thirty points along the wire and work out the sag between each of those points – we then draw a series of straight lines between each point. Our curve is actually a series straight lines between each of these points, but as you can see the visual impact is effective.

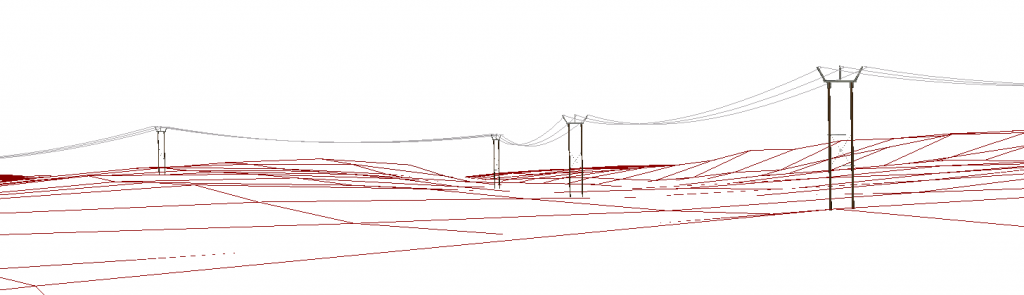
Line sag modelling has been added to all Grid projects that use conductor lines.
Limitations
This is only an approximation of how line sag works, I have asked an engineer how line sag is actually calculated and discovered it is far more complicated than I wanted to represent in a generic Visual Assessment tool like VentusAR.
This formula could cause conductor lines to be drawn underground – it is up to the person who set up the model to ensure that the span between towers is reasonable. Custom modelling is, of course, available on any project where additional detail is required.
More Information
For more information about line sag and how we can help you visualise and assess your Grid projects, tower and conductor lines, give us a shout at hello@ventusar.com