
My View
Contents
The My View visualisation tool allows a visualisation to be generated from a particular location.
Creating a photo wireline
When the My View mode is launched it will start the camera as the back of the screen and load the necessary terrain information to show the turbines at the correct location based on the devices location. The devices location comes from the internal location sensor (or chosen location if relocated).
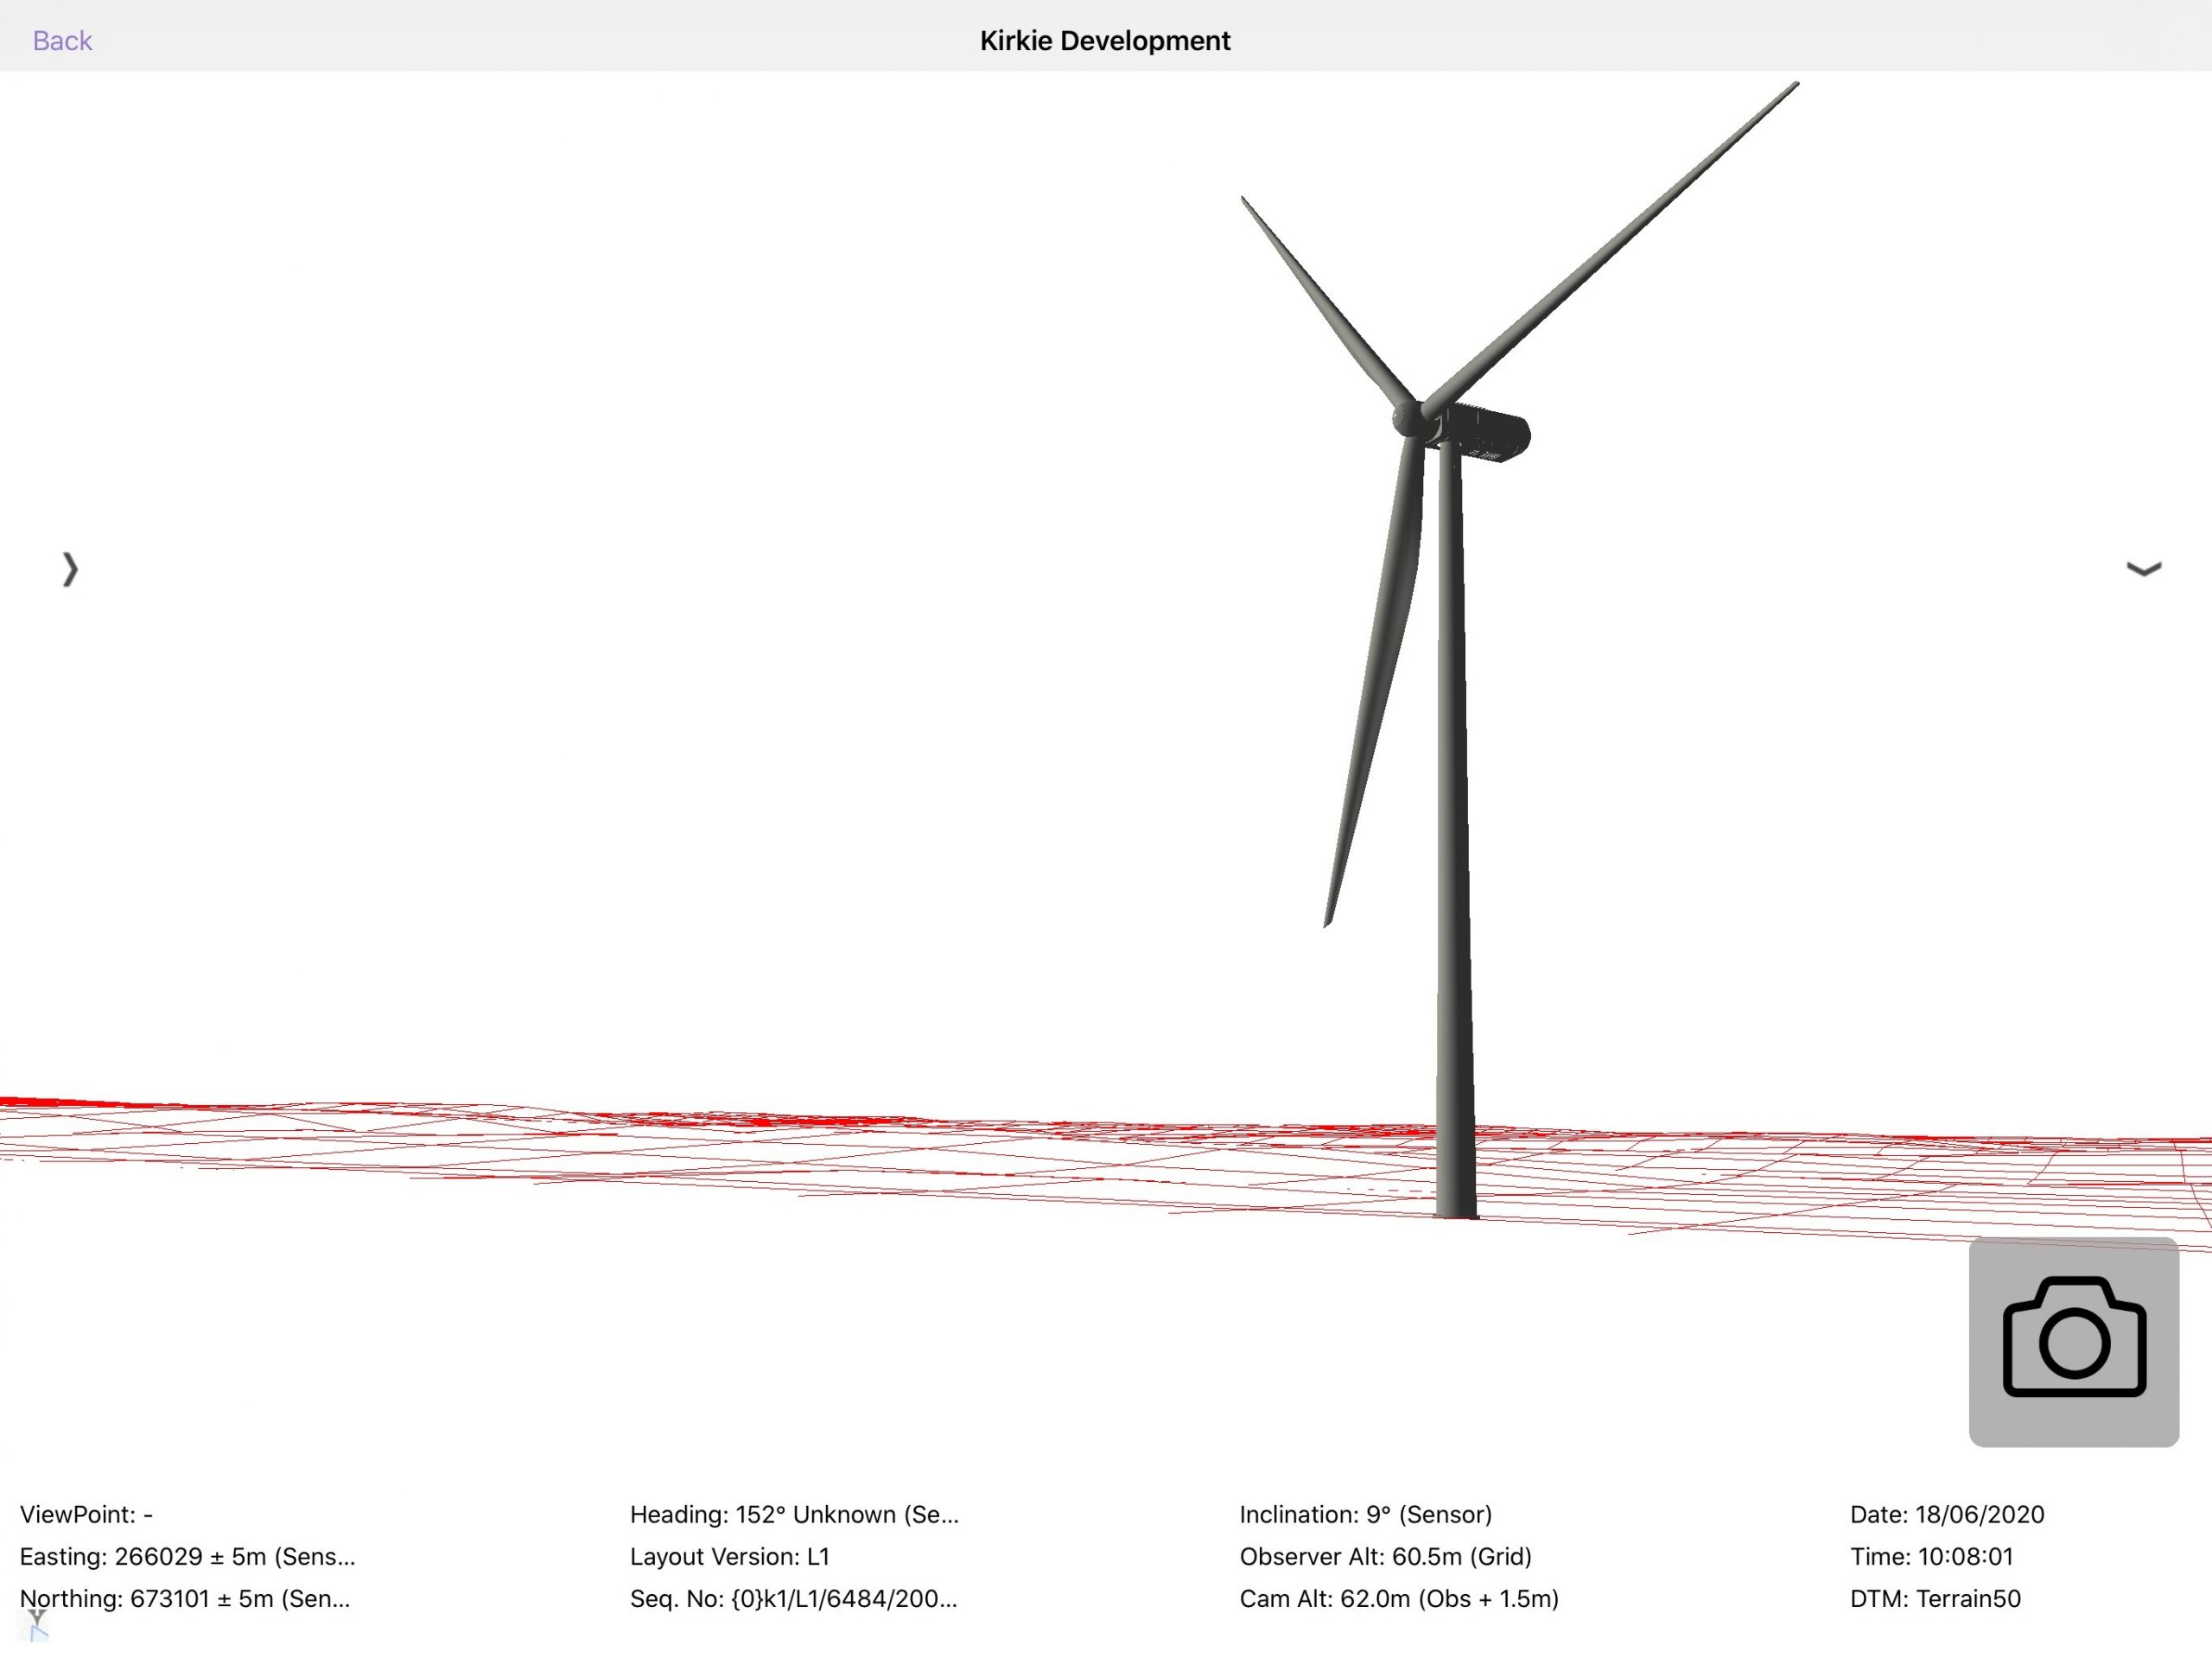
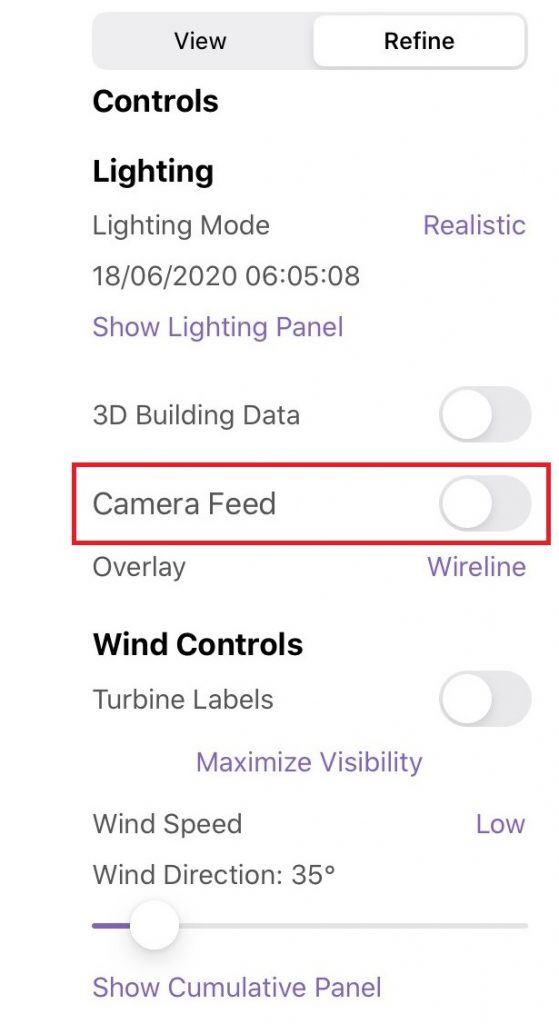
The entire screen shows the visualisation. By default the camera feed is visible in the background; this can be turned on or off using the ‘Camera Feed’ button in the right-hand panel (see Figure 12) The right-hand panel is discussed further in My View with Right Panel
The buttons and controls used in the My View are described below.
| Button | Location | Action |
 | Top left | Returns to previous page |
 | Middle left | Expands the left-hand calibration panel |
 | Middle right | Expands the right-hand panel (see My View with Right Panel) |
 | Bottom left | Show / hide the context map |
My View with right panel
The right-hand panel is divided into two tabs:
- View – used to show metadata information about the visualisation
- Refine – used to control the visualisation

View tab
The View tab shows the location, heading and inclination of the current view.
The metadata is shown in the right panel of the My View visualisation is described below. This metadata shows value and source (and where appropriate accuracy and any calibration that has been used).
The metadata shown is dependant on which domain the project is – wind, solar, building or grid.
| Domain | xxx | Metadata | xxxxx | Example | xxxxx | Description |
| All | Location | Easting: 266028 +5m (Sensor) Northing: 673101 +5m (Sensor) | The location the visualisation has been created from. The accuracy is reported by the location sensor, this disappears when relocated as you are placed at a location. The source is shown in brackets and can be “sensor” or “user set” | |||
| All | Heading | 125° Grid (sensor) | Heading shows the direction the tablet is facing Grid refers to the north reference the device is currently using. Options are Grid, Mag or True depending on whether the convergence and declination transforms are enabled The source is shown in brackets can be “sensor” or “user set” When an offset is added in the calibration panel, the reading will be “125° Grid (sensor + 1.5)”. This states the heading is based on the sensor value + 1.5° of calibration | |||
| All | Inclination | -21° (Sensor) | The inclination of the device. 0° is looking parallel to the ground The source is shown in brackets | |||
| All | Observer Altitude | 60.5m (Grid) | The altitude of the ground at the location the visualisation is generated from (derived from the terrain model at visualisation location – the altitude from the GPS sensor is ignored). Height overrides are shown after the source e.g. “60.5m (Grid + 1m) | |||
| All | Camera Alt: | 62.0m (Obs +1.5m) | Camera altitude is always calculated as 1.5m above the observer altitude | |||
| All | Sequence Number | Glas/V1/73/140116/1 | A unique reference number of this visualisation made up of the following components: • The first 4 characters of the Project Name • The project code (or first four characters of the Layout Version if code is empty) • The unique identifier of the device in our database • The date the visualisation was launched in format YYMMDD • The number of times the visualisation has been launched on that day The sequence number is only visible in My View (Camera) mode. | |||
| All | Angle of View | 60.8° | The horizontal field of view of the current view | |||
| All | Occupy | 0° (162 – 162) | The angle the models occupy in the field of view and the bearing of the two edges. | |||
| Wind only | Nearest Turbine | 220m | The distance to the nearest turbine | |||
| Solar only | Nearest Panel | 71740m | The distance to the nearest solar panel | |||
| Building only | Nearest Building | 76890m | The distance to the nearest building | |||
| Grid only | Nearest Tower | 344650m | The distance to the nearest tower |
There are a few common controls that can be controlled from the View tab.
| Domain | xxxx | Control | xxx | Description |
| All | Layout Version | The layout version that is currently being shown. Layout versions are managed in the portal | ||
| All | Start Trace | Allows you to draw a trace around the visualisation | ||
| All | Ref Structures | Show reference structures in My View | ||
| All | Show wireline | Turns the wireline on and off | ||
| All | Wireline opacity | Adjusting the slider changes the transparency of the wireline where 0% is invisible and 100% is fully opaque | ||
| All | Model Opacity | Adjusting the slider changes the transparency of the models where 0% is invisible and 100% is fully opaque | ||
| All | Wireline Colour | Allows the wireline colour to be changed – choices are Red, Green, Blue, Cyan, Magenta, Yellow, Black, White, Grey |
Refine tab
The Refine tab allows control over the way that the visualisation is produced. The controls shown are dependant on which domain the project is – wind, solar, building or grid.
| Domain | xxxxxx | Control | xxx | Description |
| All | Lighting Mode | Changes the lighting to either Realistic or Ambient. | ||
| All | Show Lighting Panel | Opens the lighting panel and allows the date and time to be changed. | ||
| All | 3D Building Data | Turns the 3D building data on and off | ||
| All | Camera Feed | Turns the camera feed off and on | ||
| All | Overlay | Whether to show an overlay showing the terrain model or to exclude it. By default My View is launched with Wirelines enabled, other options include: • Wireline • Base Mapping • No Terrain • Any overlays uploaded through the portal | ||
| All | Render Sky | Renders the sky to a realistic view | ||
| Wind only | Turbine Labels | Turns the Turbine Labels off and on | ||
| Wind only | Maximum Visibility | Stops the turbines rotating and faces them to the camera. This provides the most visibility. | ||
| Wind only | Wind Speed | Controls the speed the turbine is animated at: Still, Low, Medium, High, Max, Double | ||
| Wind only | Wind Direction | Controls the direction the turbine blades face | ||
| Wind only | Show Cumulative Panel | Enables or disables all cumulative projects. This is a quick way of turning on / off all the cumulative turbines in one switch. | ||
| Building only | Show as outlines | Changes the building model from solid to showing outlines | ||
| Building only | Colour | Changes the building colour |
My View bottom panel
The bottom panel can be used instead of the right panel to show the metadata about the visualisation that is currently being viewed. This panel is designed to show make the metadata visible at the bottom of the screen so as not to interfere with the camera feed shown above.
The bottom panel is visible when the right and left panels are collapsed.
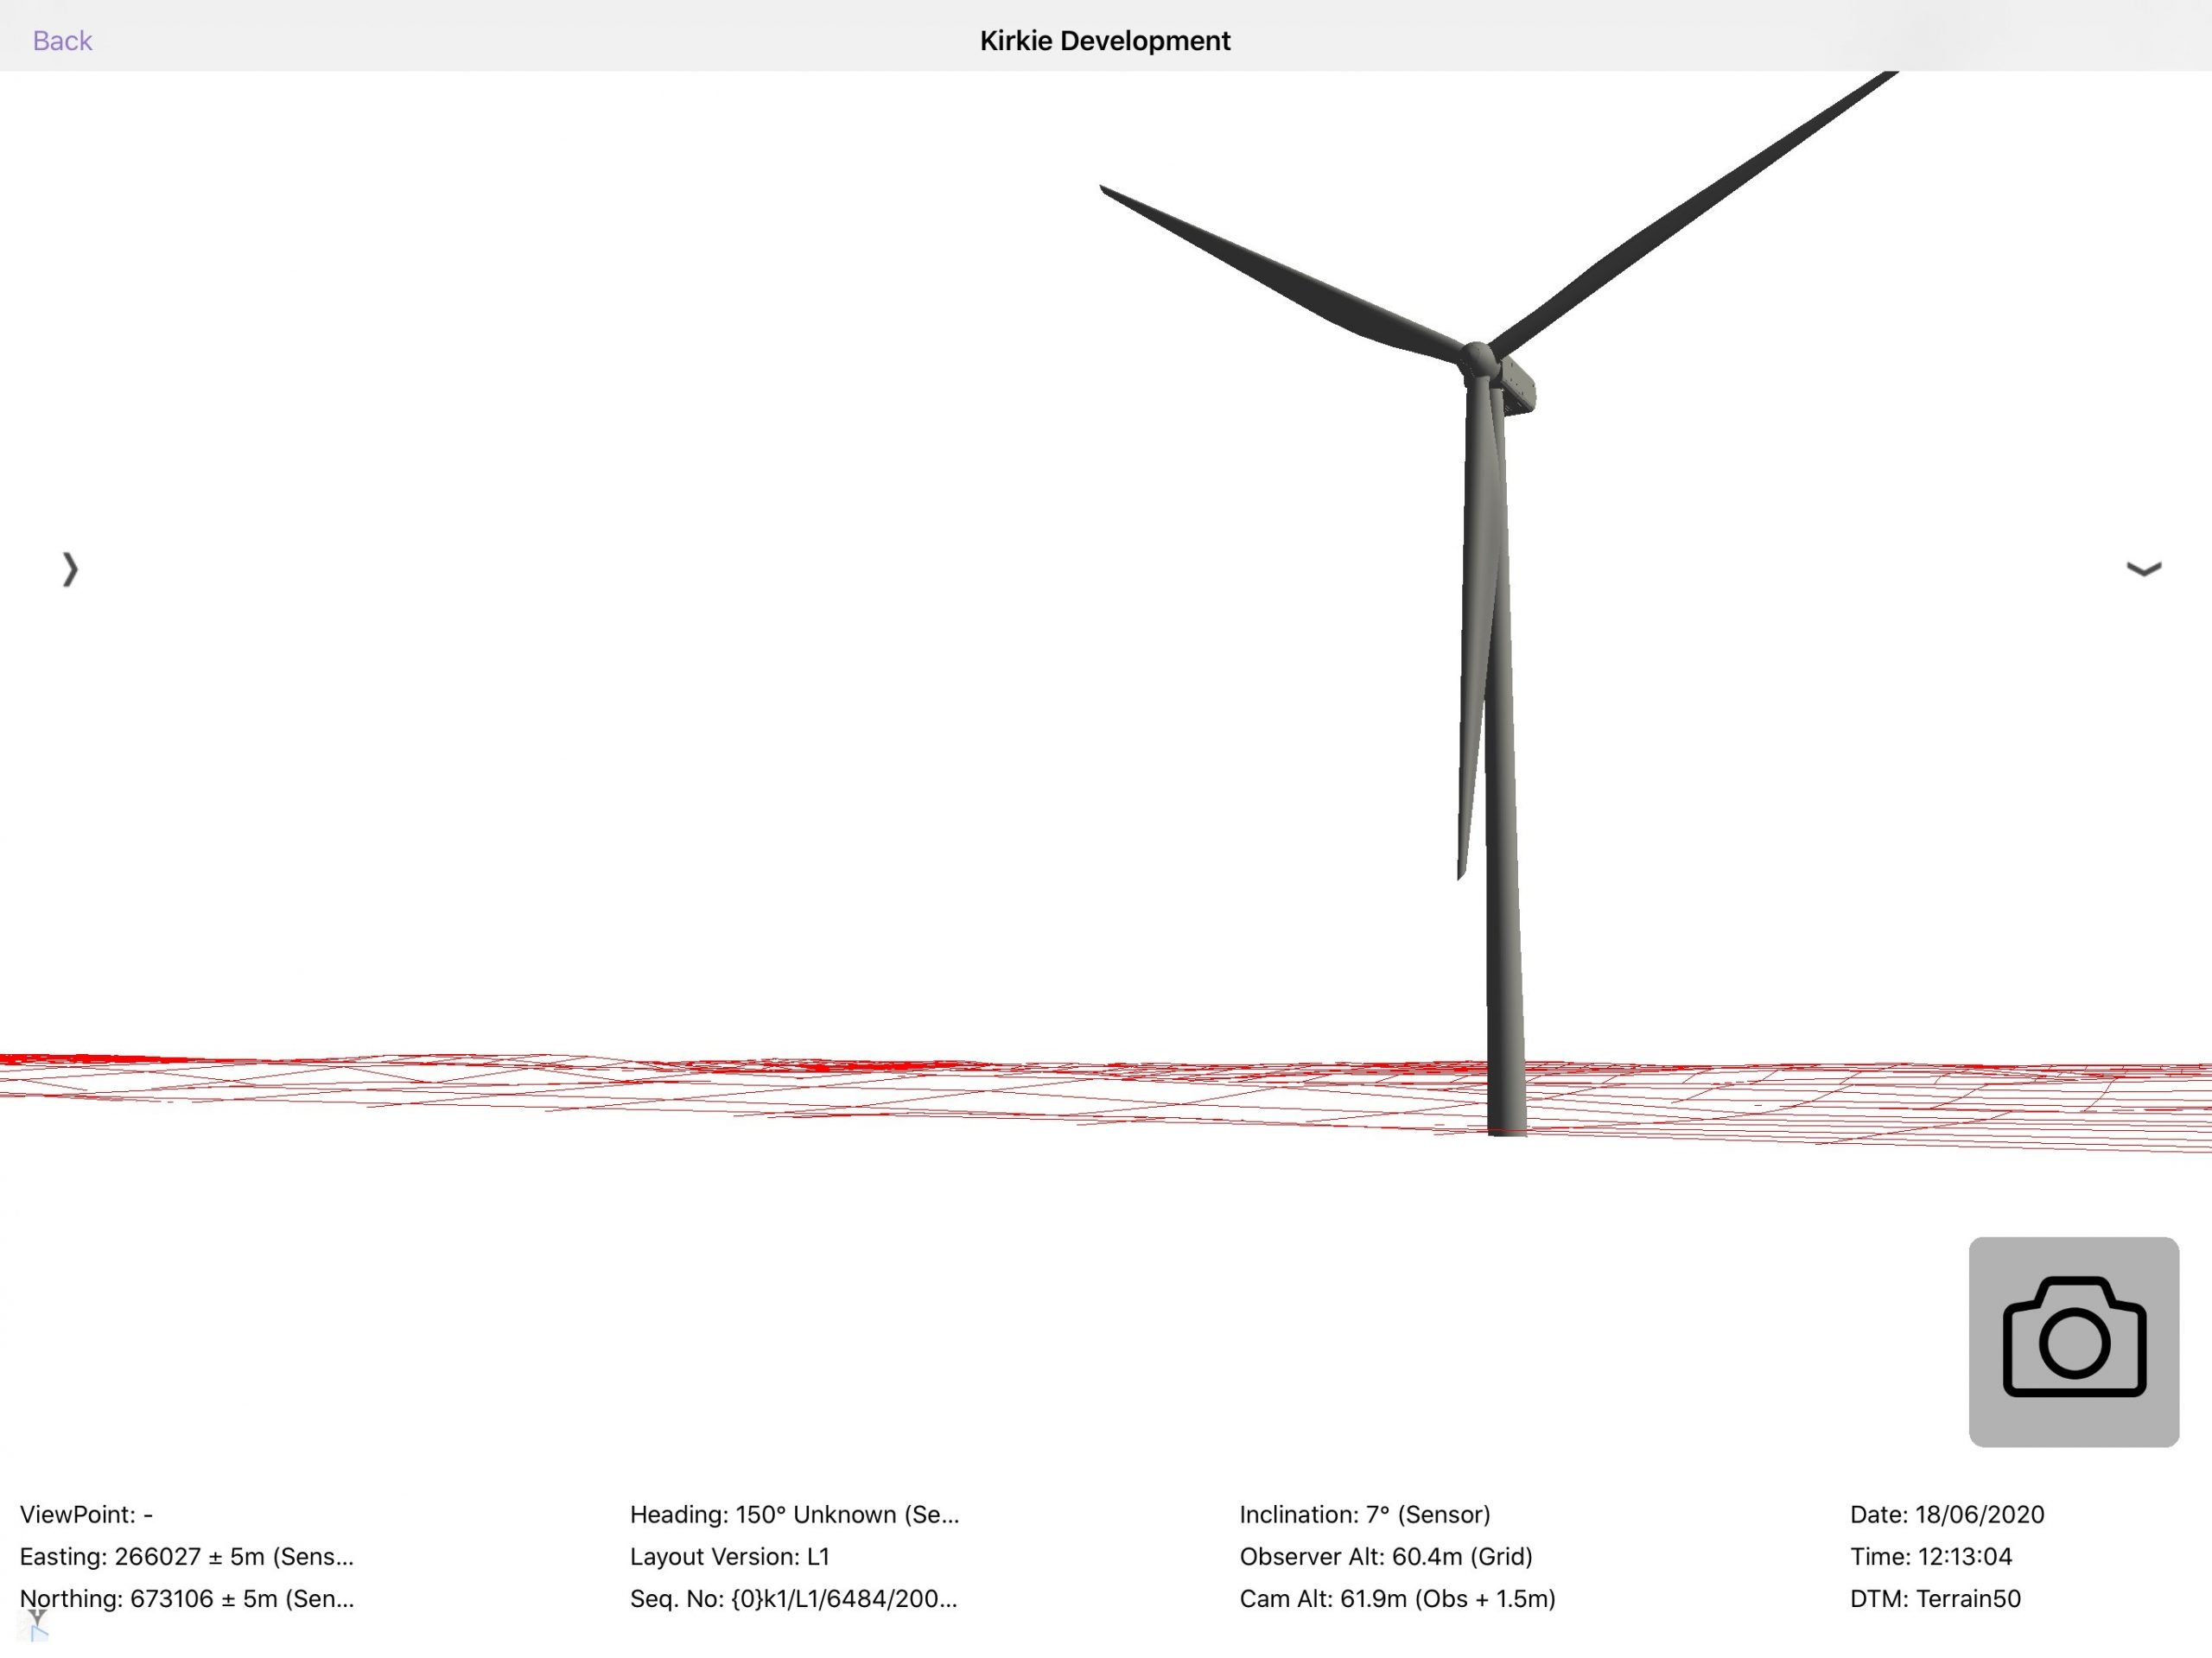
The additional metadata shown is described below.
| Metadata | xxxxxx | Example | xxx | Description |
| Viewpoint | VP1 | The Viewpoint name. This will be blank if the visualisation is not shown from a chosen viewpoint | ||
| Date | 18/06/2020 | The current date | ||
| Time | 12:18:55 | The current time | ||
| DTM | Terrain50 | The DTM that has been used to generate the visualisation. DTMs can be managed in the portal |
Context map
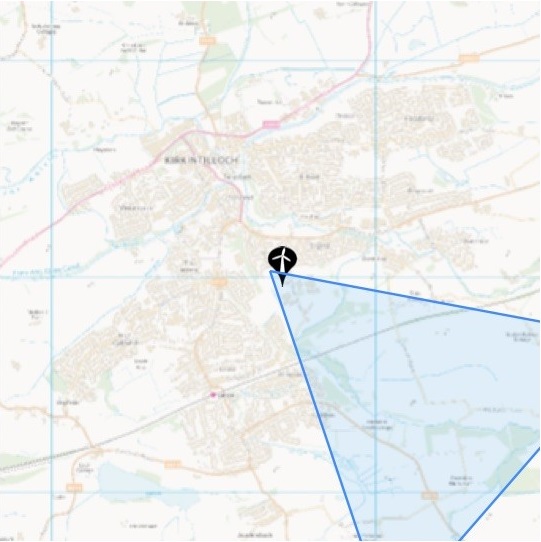
A context map is shown in the bottom right corner to allow you to understand where the visualisation is taken from and to understand where you are looking in relation to where the models are. If you are within 2.5km of the model, a background map will be shown, if you are further than 2.5km away the map is not shown.
The device’s location is always at the centre of the context map. The model locations are shown as a pin at their locations. The visible field of view is shown as a blue triangle projected on the context map.
The context map can be collapsed and expanded by tapping on it.
Lighting panel
By default, the visualisation is generated using default lighting. This is simulating the sunlight coming from a set direction. To enable real-world lighting, expand the lighting control panel by using the show lighting switch in the options tab. This will bring up a lighting control panel.
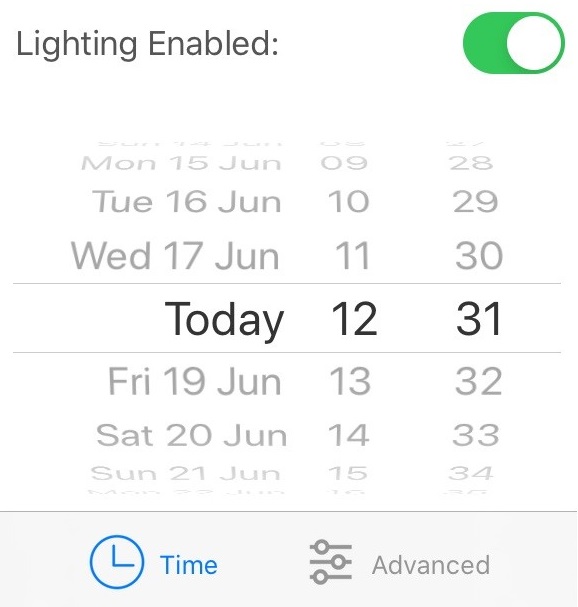
The different controls available in the lighting panel are described below.
| Function | Example | Description |
 | Off / On | Use default lighting (off) or real-world lighting (on) |
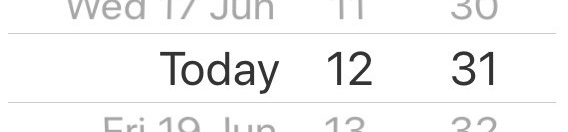 | Today 12:31 | Turning on real-world lighting will use the current date/time of the iPad to calculate the direction of the light. Use this control to calculate the direction of the light at a particular date and time instead. |
 | Opens the lighting panel advanced settings |
If real-world lighting is enabled in the lighting panel, that setting is stored and used for all subsequent visualisations. For example, turning real-world lighting on in the My View will mean that it is on in the Fly Through also.
Advanced tab
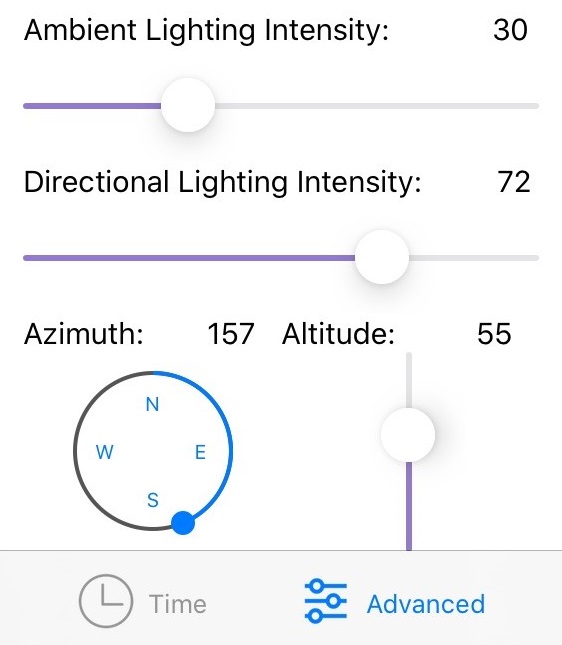
In addition to the lighting panel, the advanced tab allows you to adjust the intensity of the ambient lighting, as well as the Azimuth and Altitude of the directional lighting. This allows for more realistic lighting conditions to be rendered.
When the standard lighting control is opened, there will be an option to change to advanced mode. This will be initially set with the default values for the date and time. The sliders can be used to change the intensity and direction of the lighting.
Calibration panel
The calibration panel is shown to the left of the My View screen and is used to override the values provided by the internal iPad sensors.
The calibration panel is opened using the left-hand expander icon ( middle left). To make the calibration panel obvious, the background is red.
The calibration tools are also found in the Gallery.
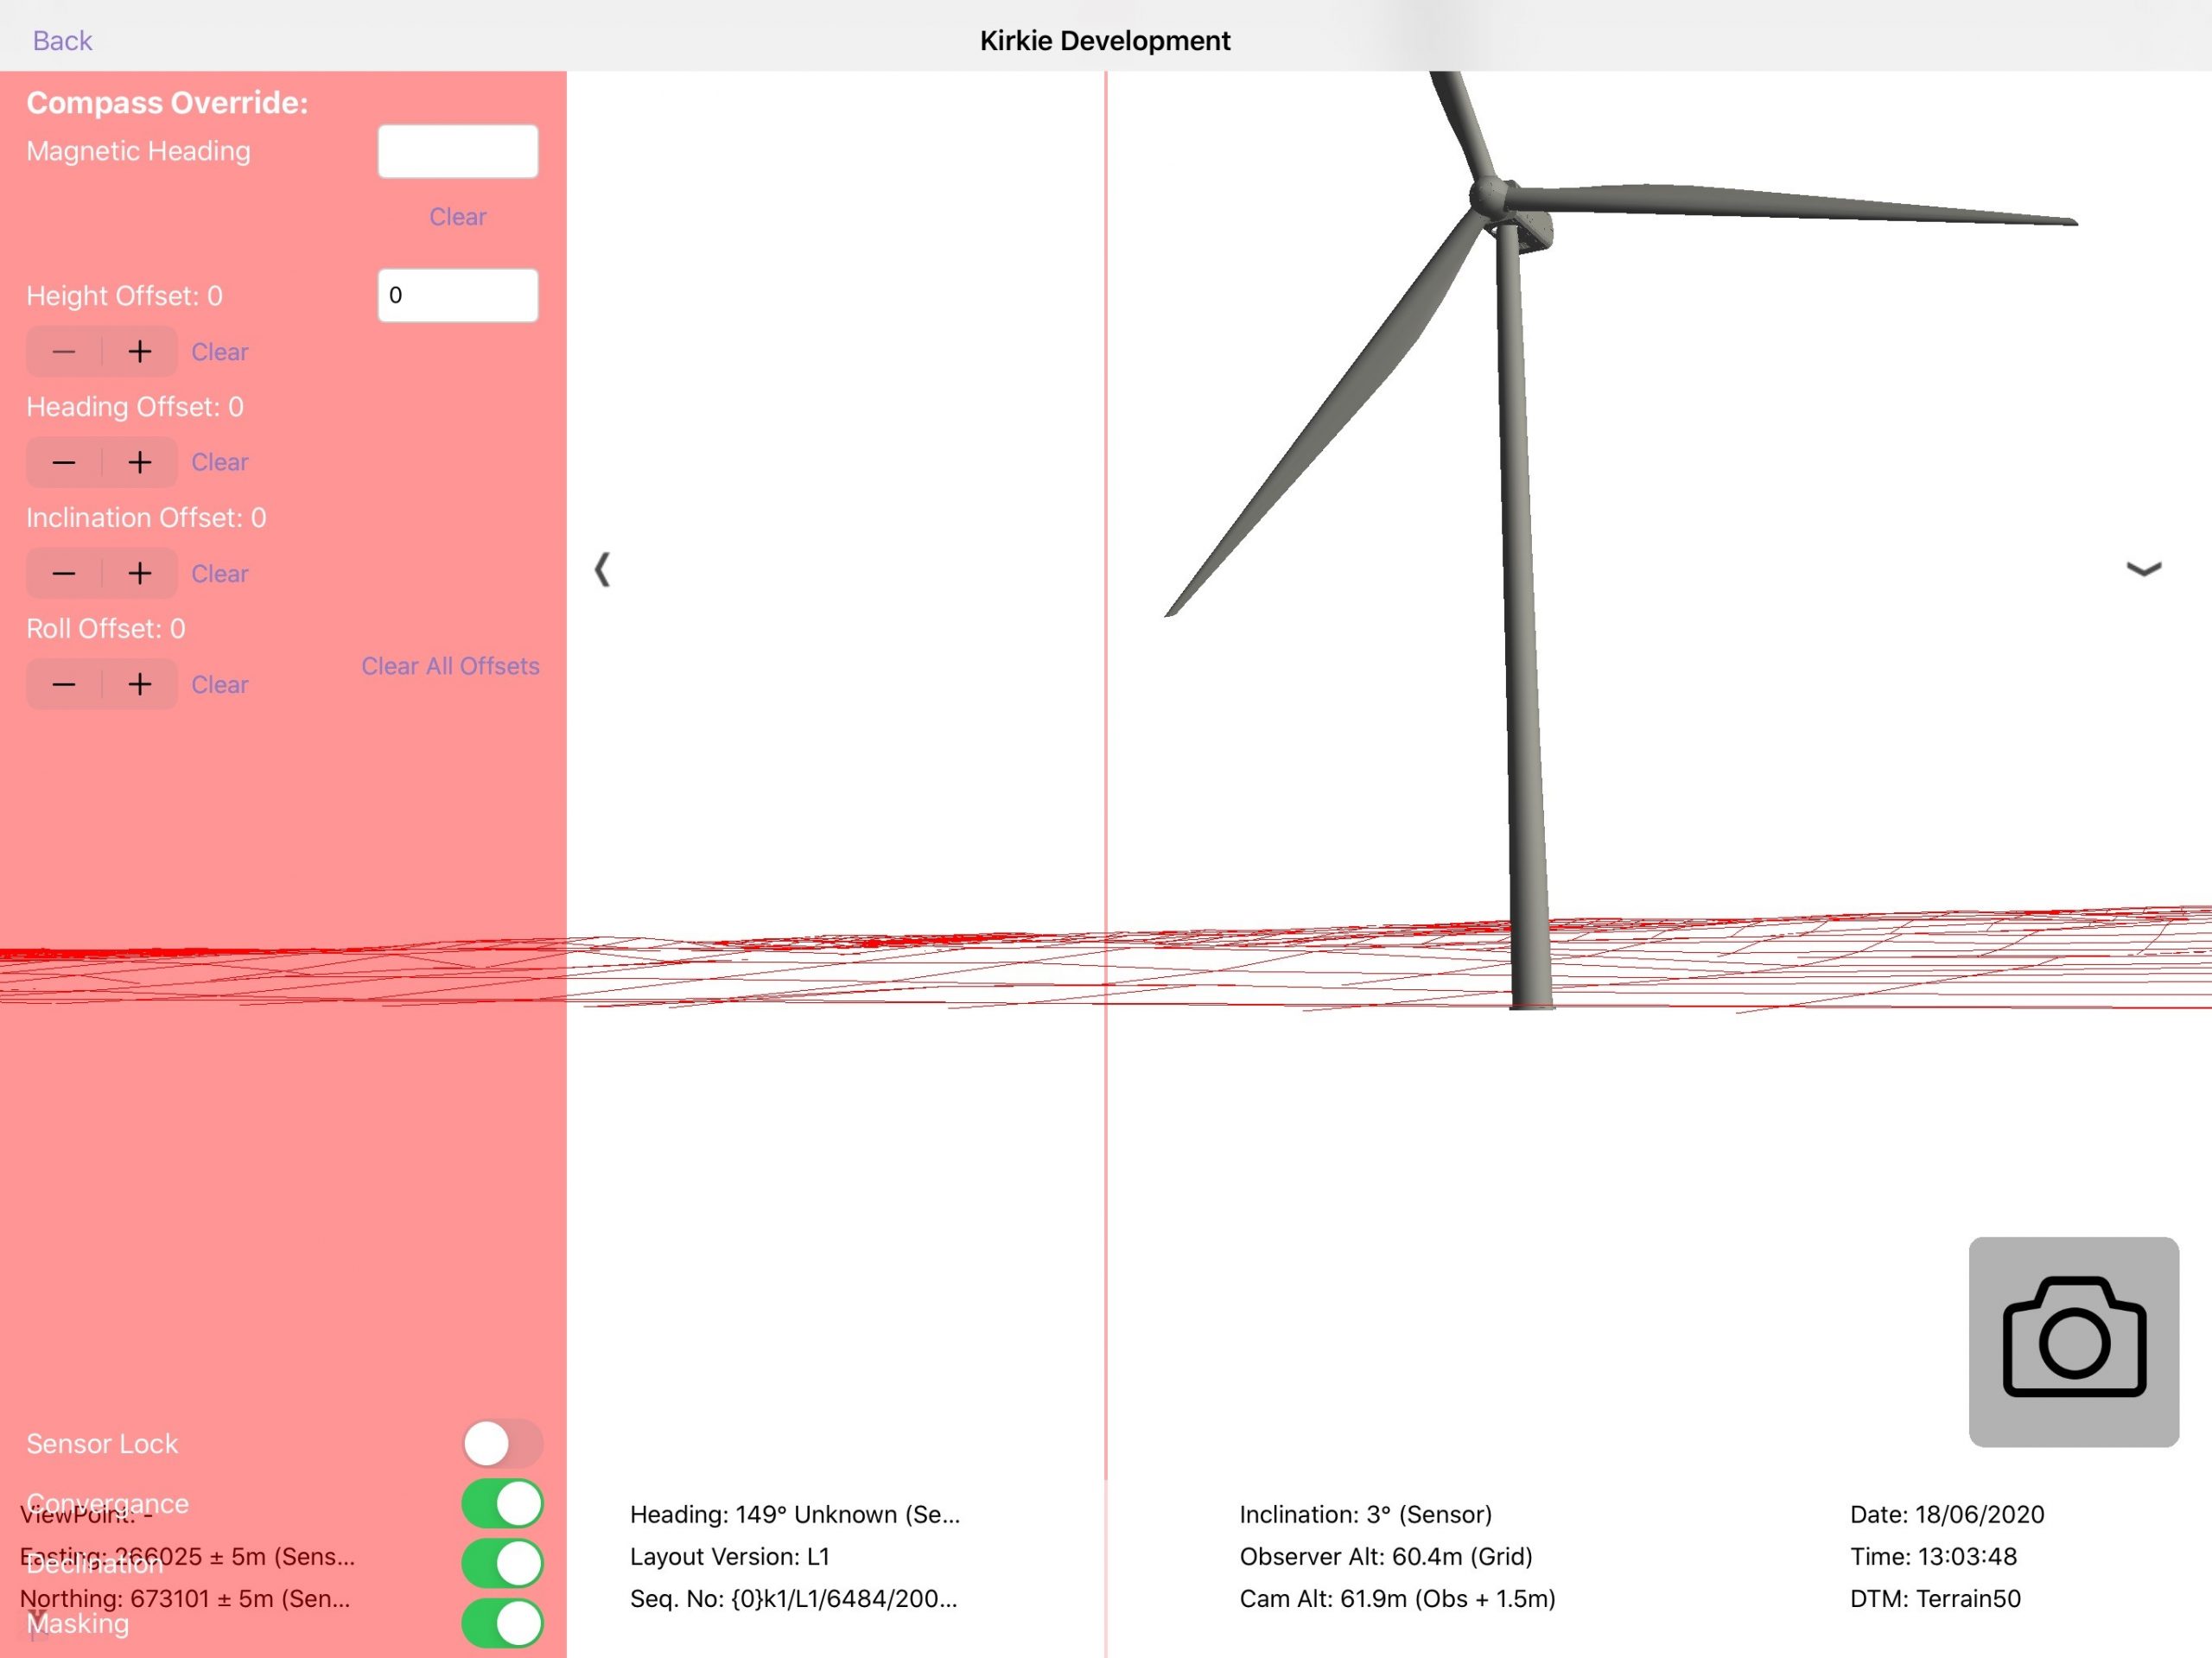
The different functions of the calibration panel are shown below.
| Function | Description |
| Red centre line | A red centre line is shown on top of the visualisation to allow the device to be accurately aligned to the real world |
| Compass override | Enter an override compass heading taken from an external compass. This is used in conjunction with the red centre-line to take a bearing of a point in the landscape and align the device to that point |
| Height offset | Raises or lowers the observer height to allow wirelines to be created at altitude (on top of buildings etc.) |
| Heading, inclination & roll offsets | These offsets are added to the sensor input to allow the sensor reading to be calibrated for magnetic variations in a certain location |
| Sensor lock | Locks all sensor input. When enabled this will stop updating the view based on the orientation of the device |
| Enable convergence / declination | The sensors in the device provide a magnetic reading. The convergence and declination transform convert magnetic to true and true to grid bearings. Both should be enabled to work in Grid, both disabled to work in magnetic |
| Enable masking | Enables/disables the masking of terrain behind other terrains. This is useful to find the turbines when they are hidden behind another landform feature |
3D model information
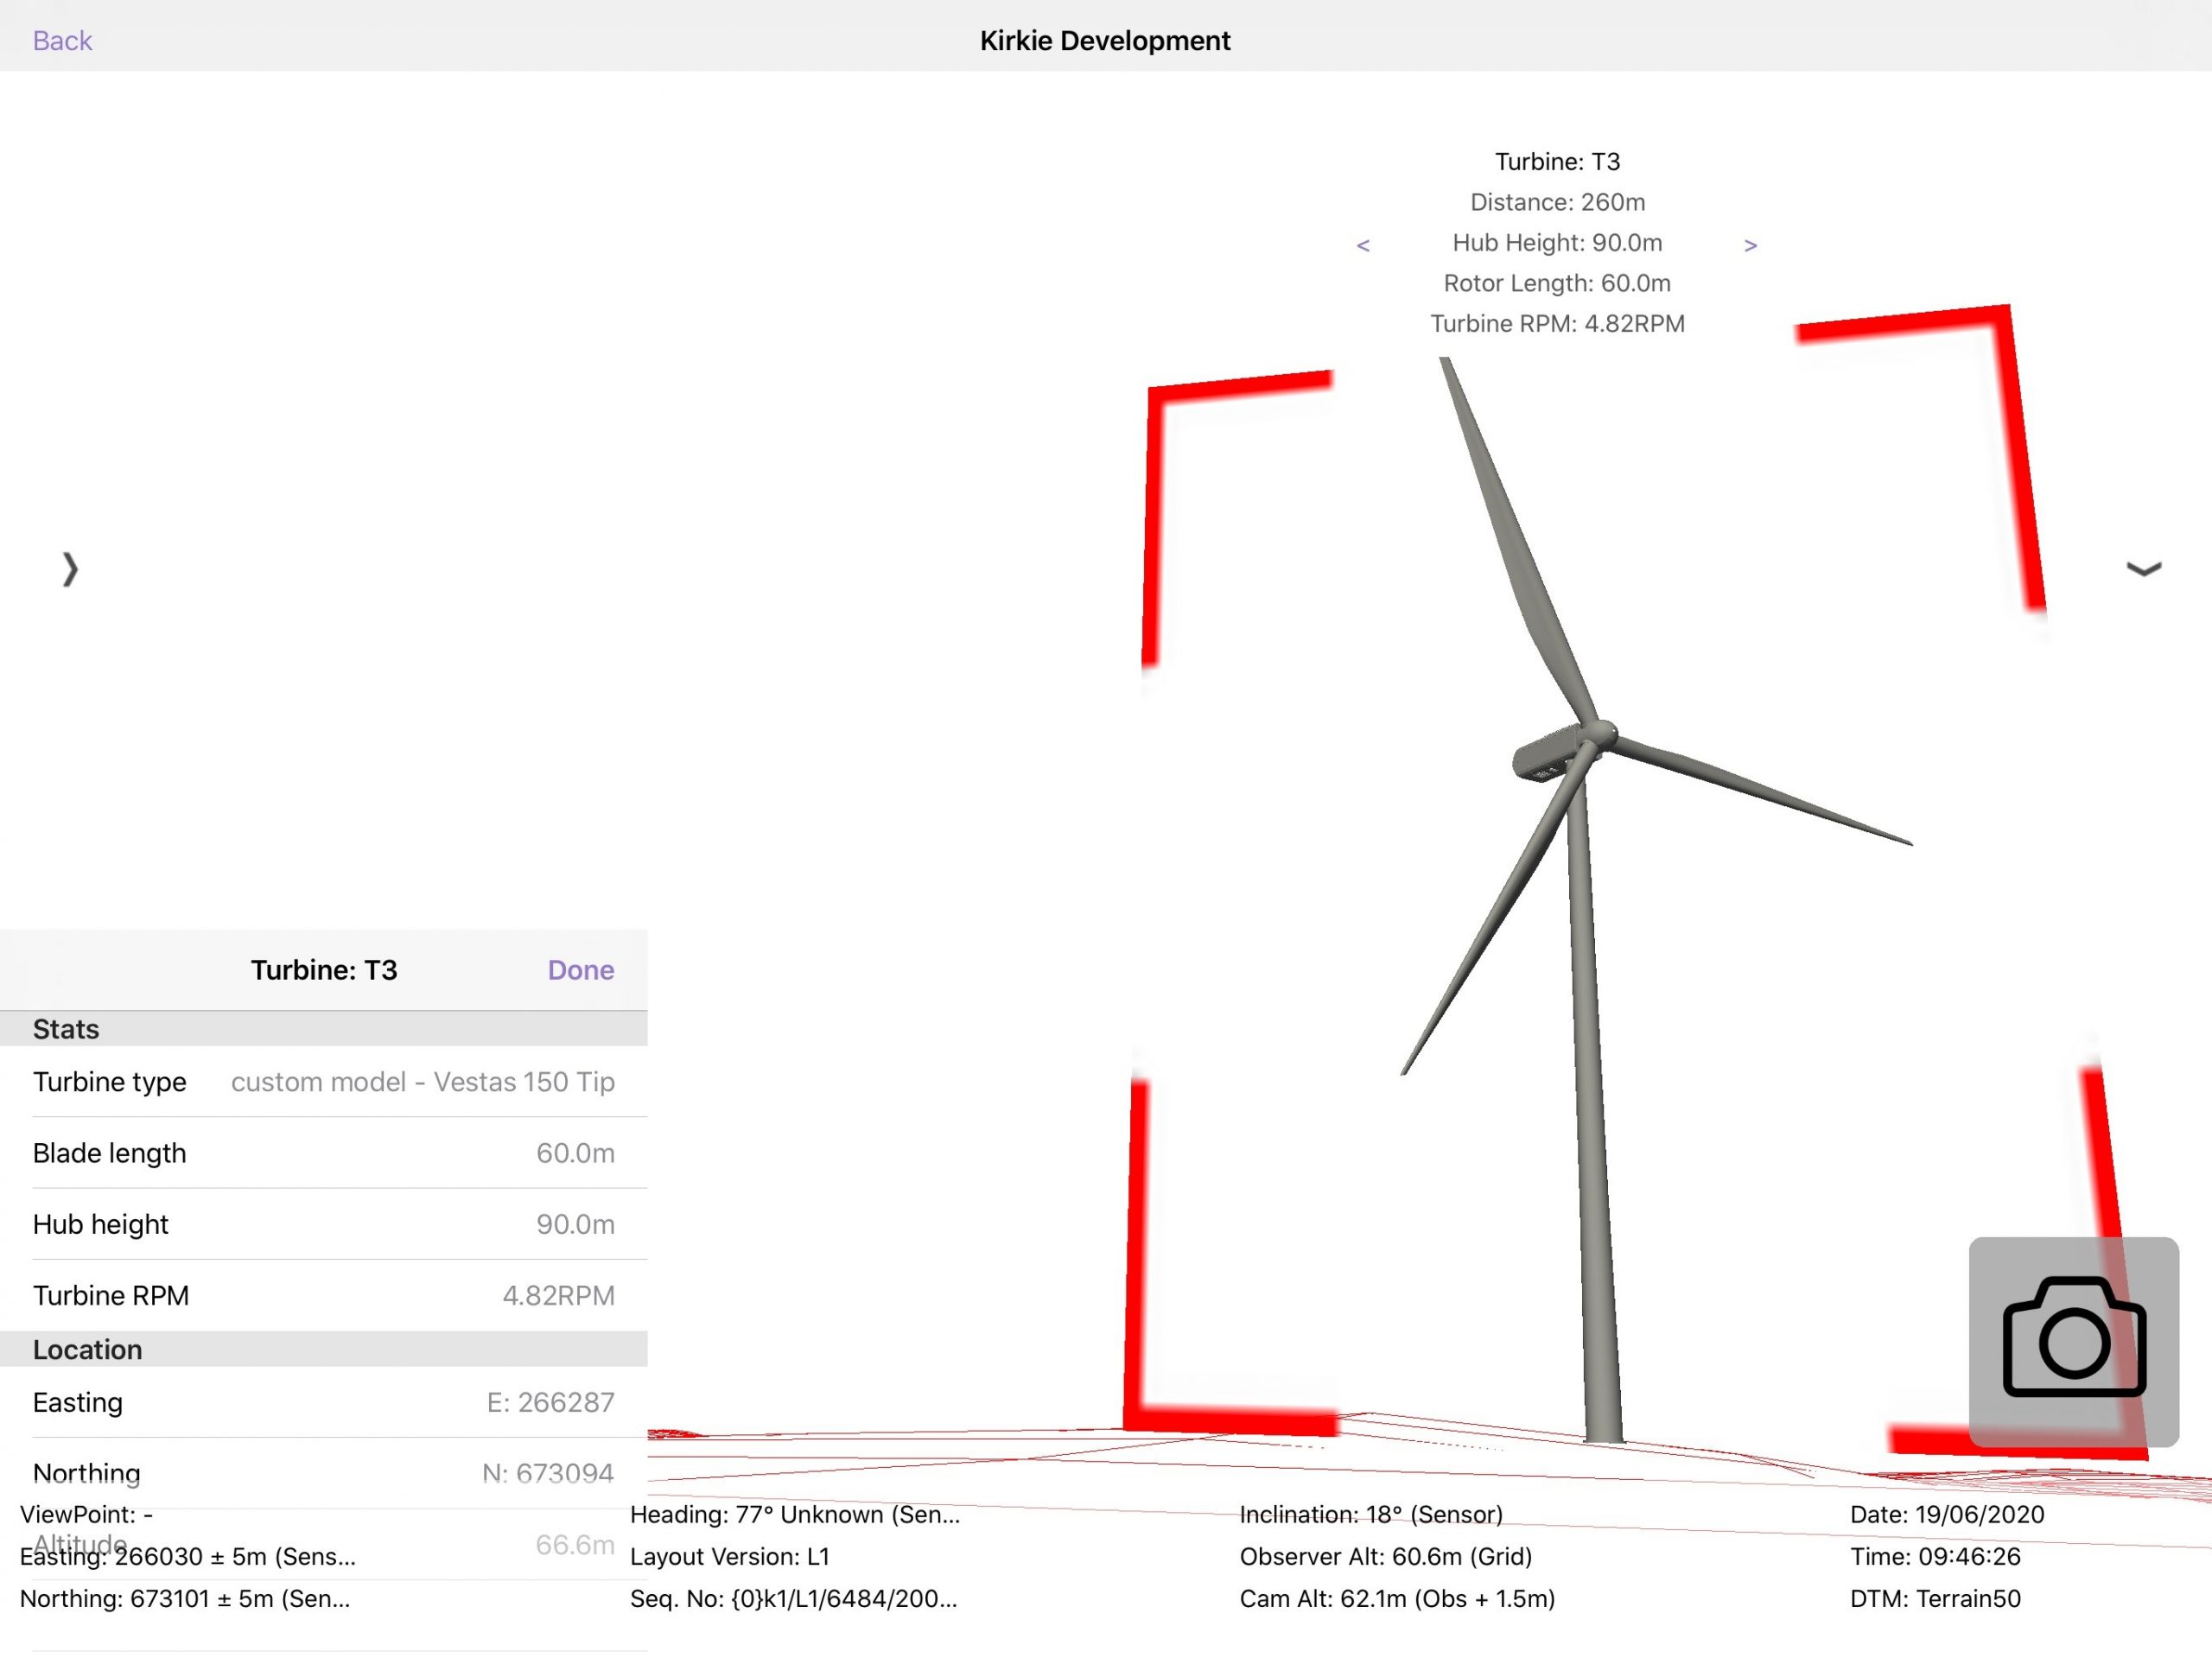
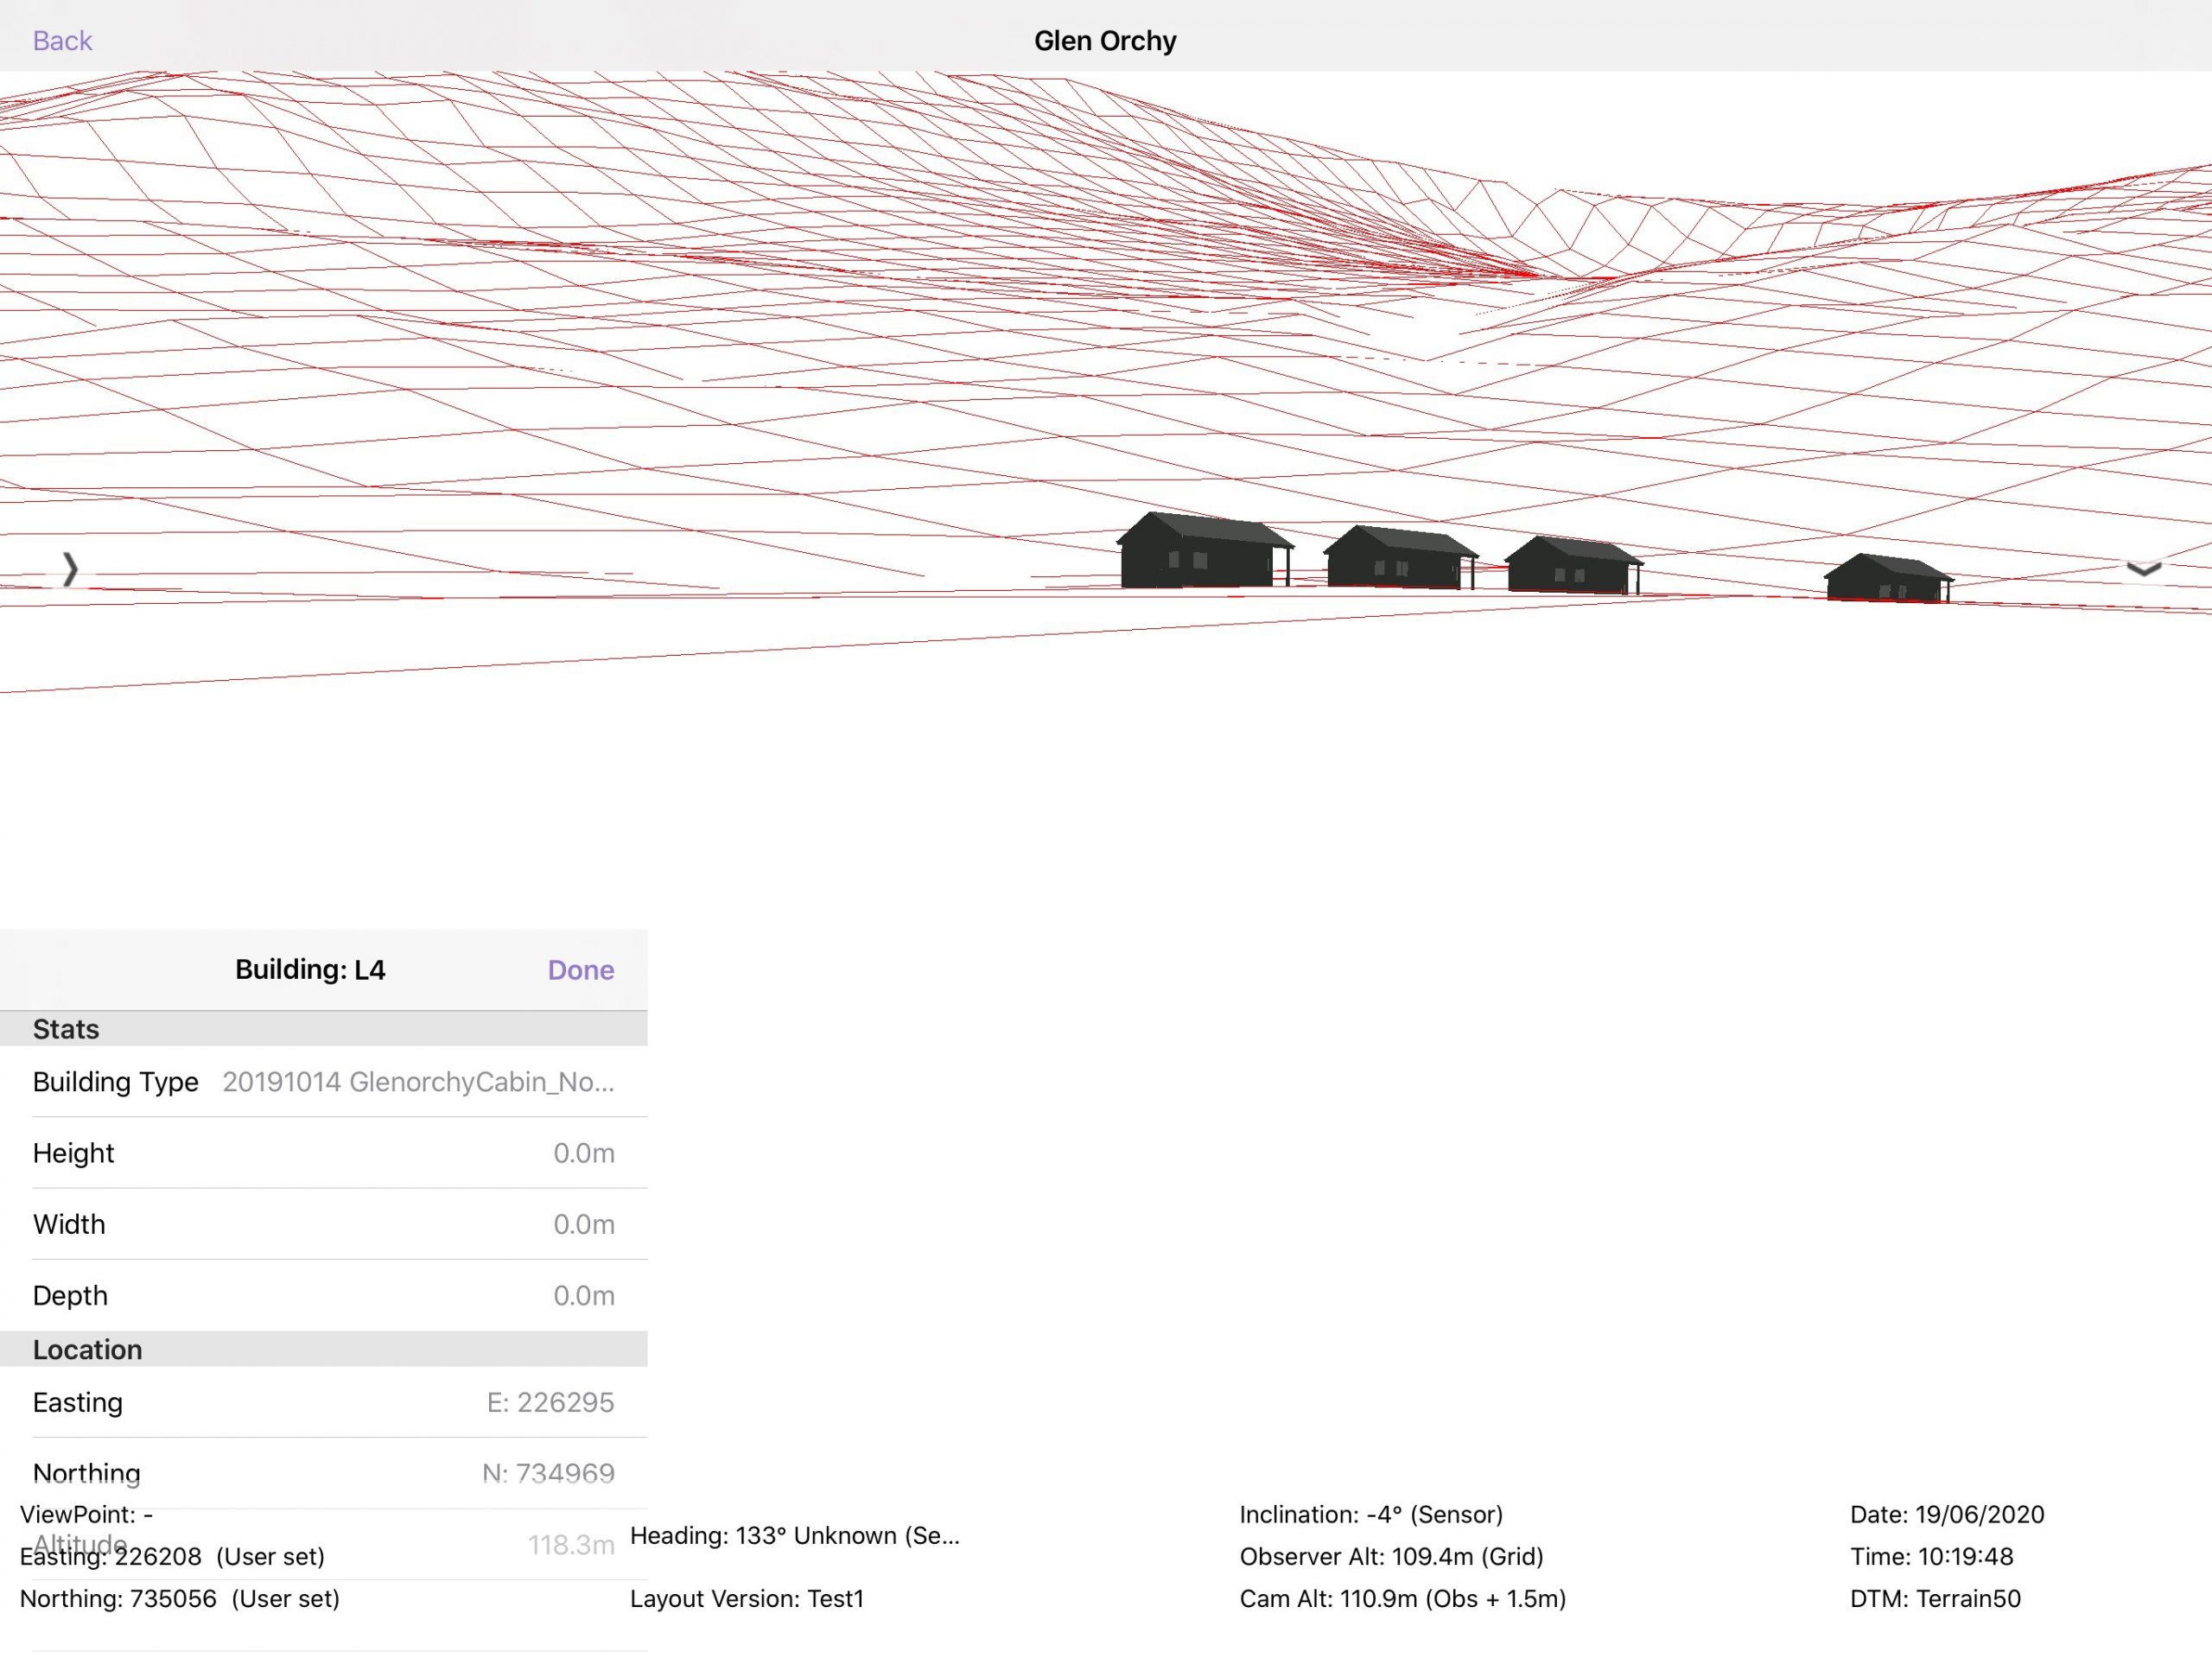
As TVV is built on a digital model, it can be used to provide a more interactive experience. Tapping on a 3D model in My View will bring up an information panel that contains more information about the model that you have selected. Two examples of this are shown below – Turbine information and Building information.
Cumulative information
Across the top of My View, a bracket structure shows the location and spread of the cumulative projects. For single turbine projects ,a single point is shown, for multi turbine projects the spread of the turbines is shown. An example is shown below.

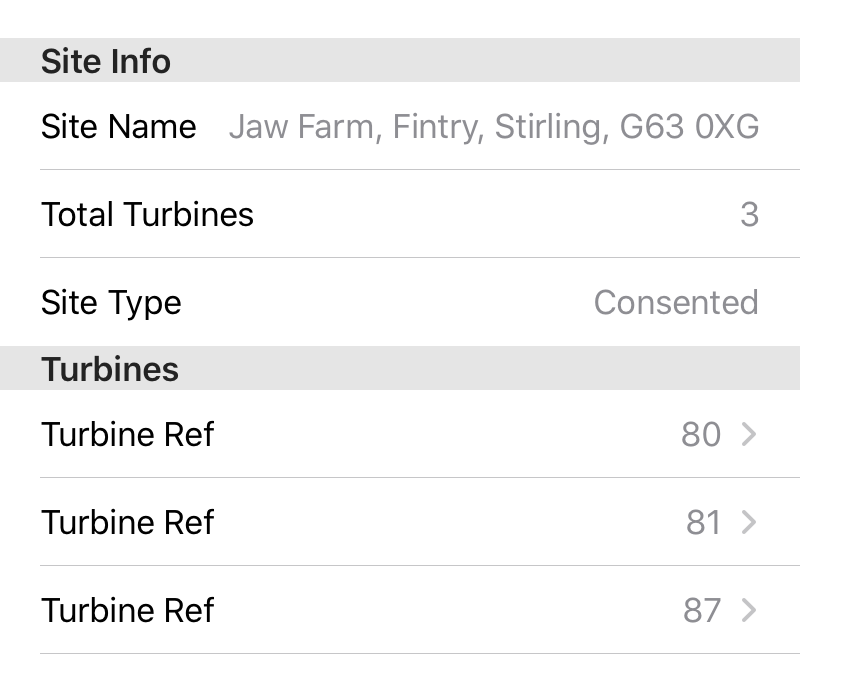
When a site name is tapped at the top of the screen more information about that site is brought up and shown in the bottom left corner.
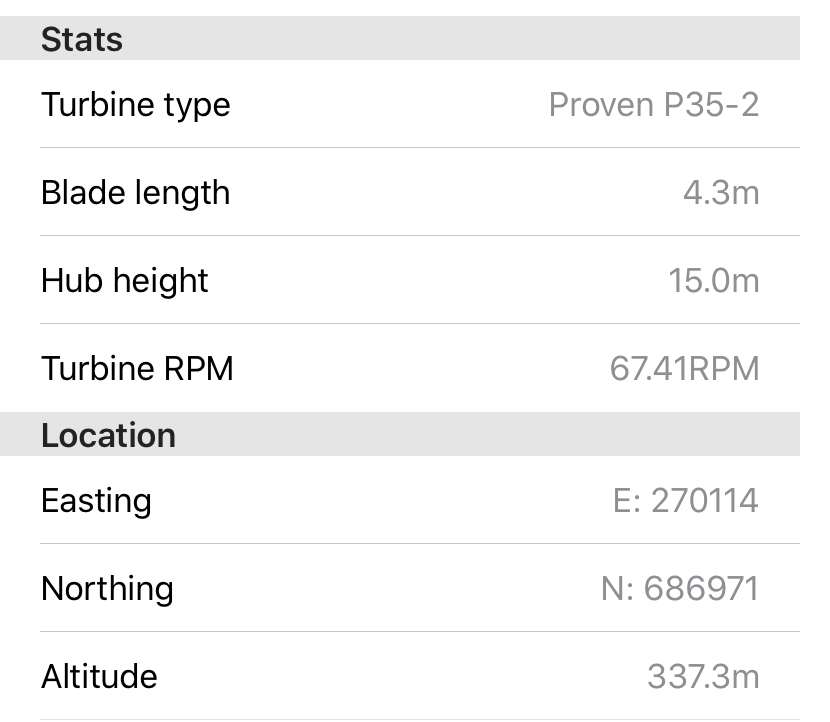
When a turbine from a cumulative project is tapped, more information about that turbine will be shown in the bottom left corner of the page.
Reference structures
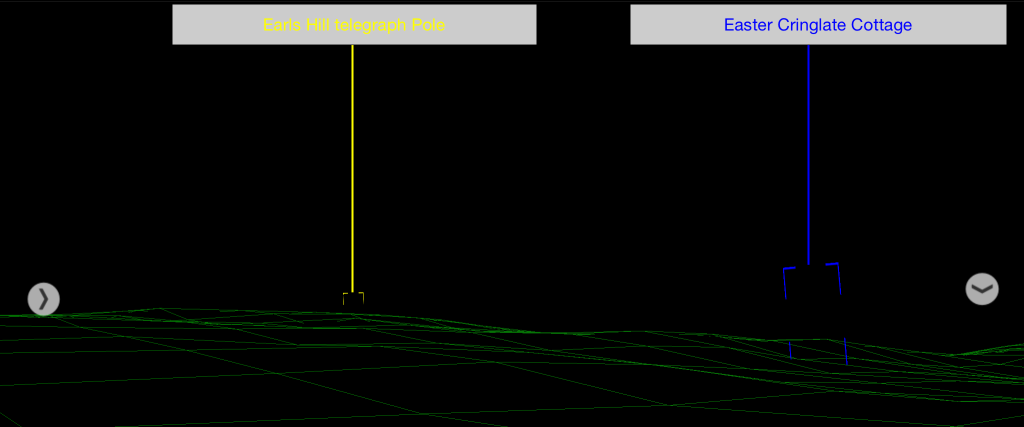
Reference Structures are shown in My View to help align the wireline to the terrain when in the field. Reference structures are added in the portal and when they are enabled they are shown at the correct size and location in My View. When viewed in My View, reference structures are shown in the colour as set in the portal. Each structure has the following 3 components:
- The outline of the structure (shown at the correct size and location on the wireline)
- The label given to the reference structure in the portal
- A vertical line joining structure and label.
To enable/disable reference structures in My View, use the toggle reference switch in the Options tab of the right panel.
Capturing the view (Capture)
The capture button ( in the bottom right when the camera feed is on) takes a photo from the iPad’s camera and captures all the metadata that is currently being used to generate the visualisation. The capture taken will be available in the gallery section.
NB. The capture button is only visible if you are not relocated.
Capturing the view (Screenshot)
iPad and iPad Pro (2017 models and earlier)

- Press the Top button and the Home button at the same time.
- Quickly release both buttons.
- A preview of the screenshot will pop up in the lower left of the display. Tap it to open up the Instant Markup interface, or let it disappear (this takes about five seconds) and it will be saved as-is.
iPad Pro (2018 models and later)
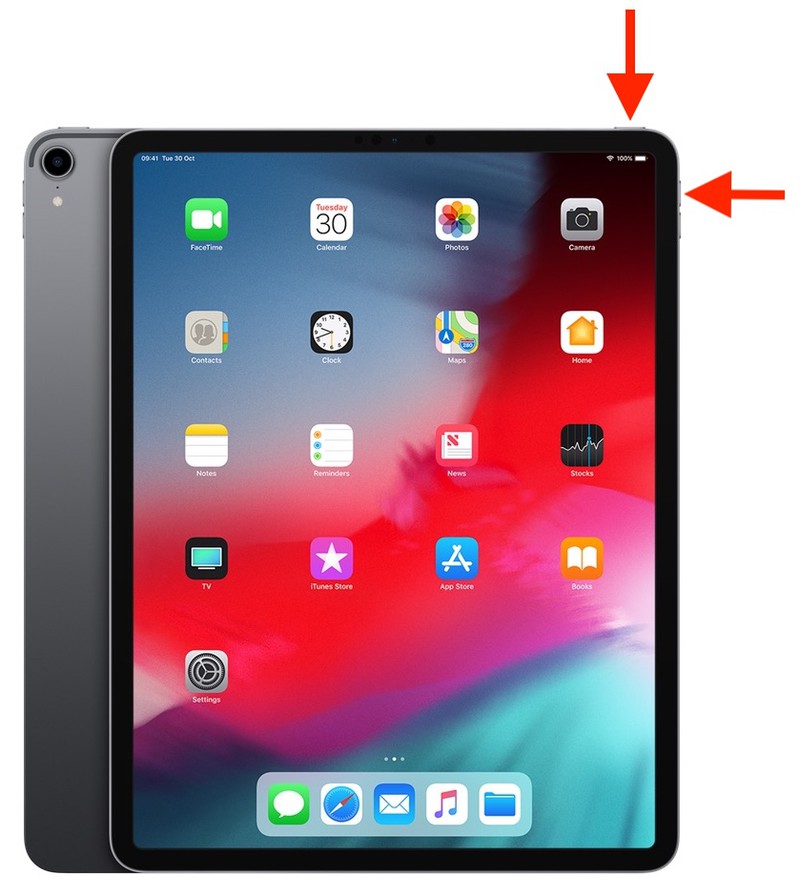
- Press the Power button on the top of the device and the Volume up button located on the right of the device at the same time.
- Quickly release both buttons.
- A preview of the screenshot will pop up in the lower left of the display. Tap it to open up the Instant Markup interface, or let it disappear (this takes about five seconds) and it will be saved as-is.
When you take a screenshot on your iOS device, it’s automatically saved to your Photo library, where they can be shared using email or copied off the iPad by connecting the iPad to the computer.
Distraction-free mode
Enter distraction-free mode by double-tapping anywhere in the visualisation, this will hide all menus and just show the 3D visualisation.
To restore the menus simply double tap again.
