Fly Through
Contents
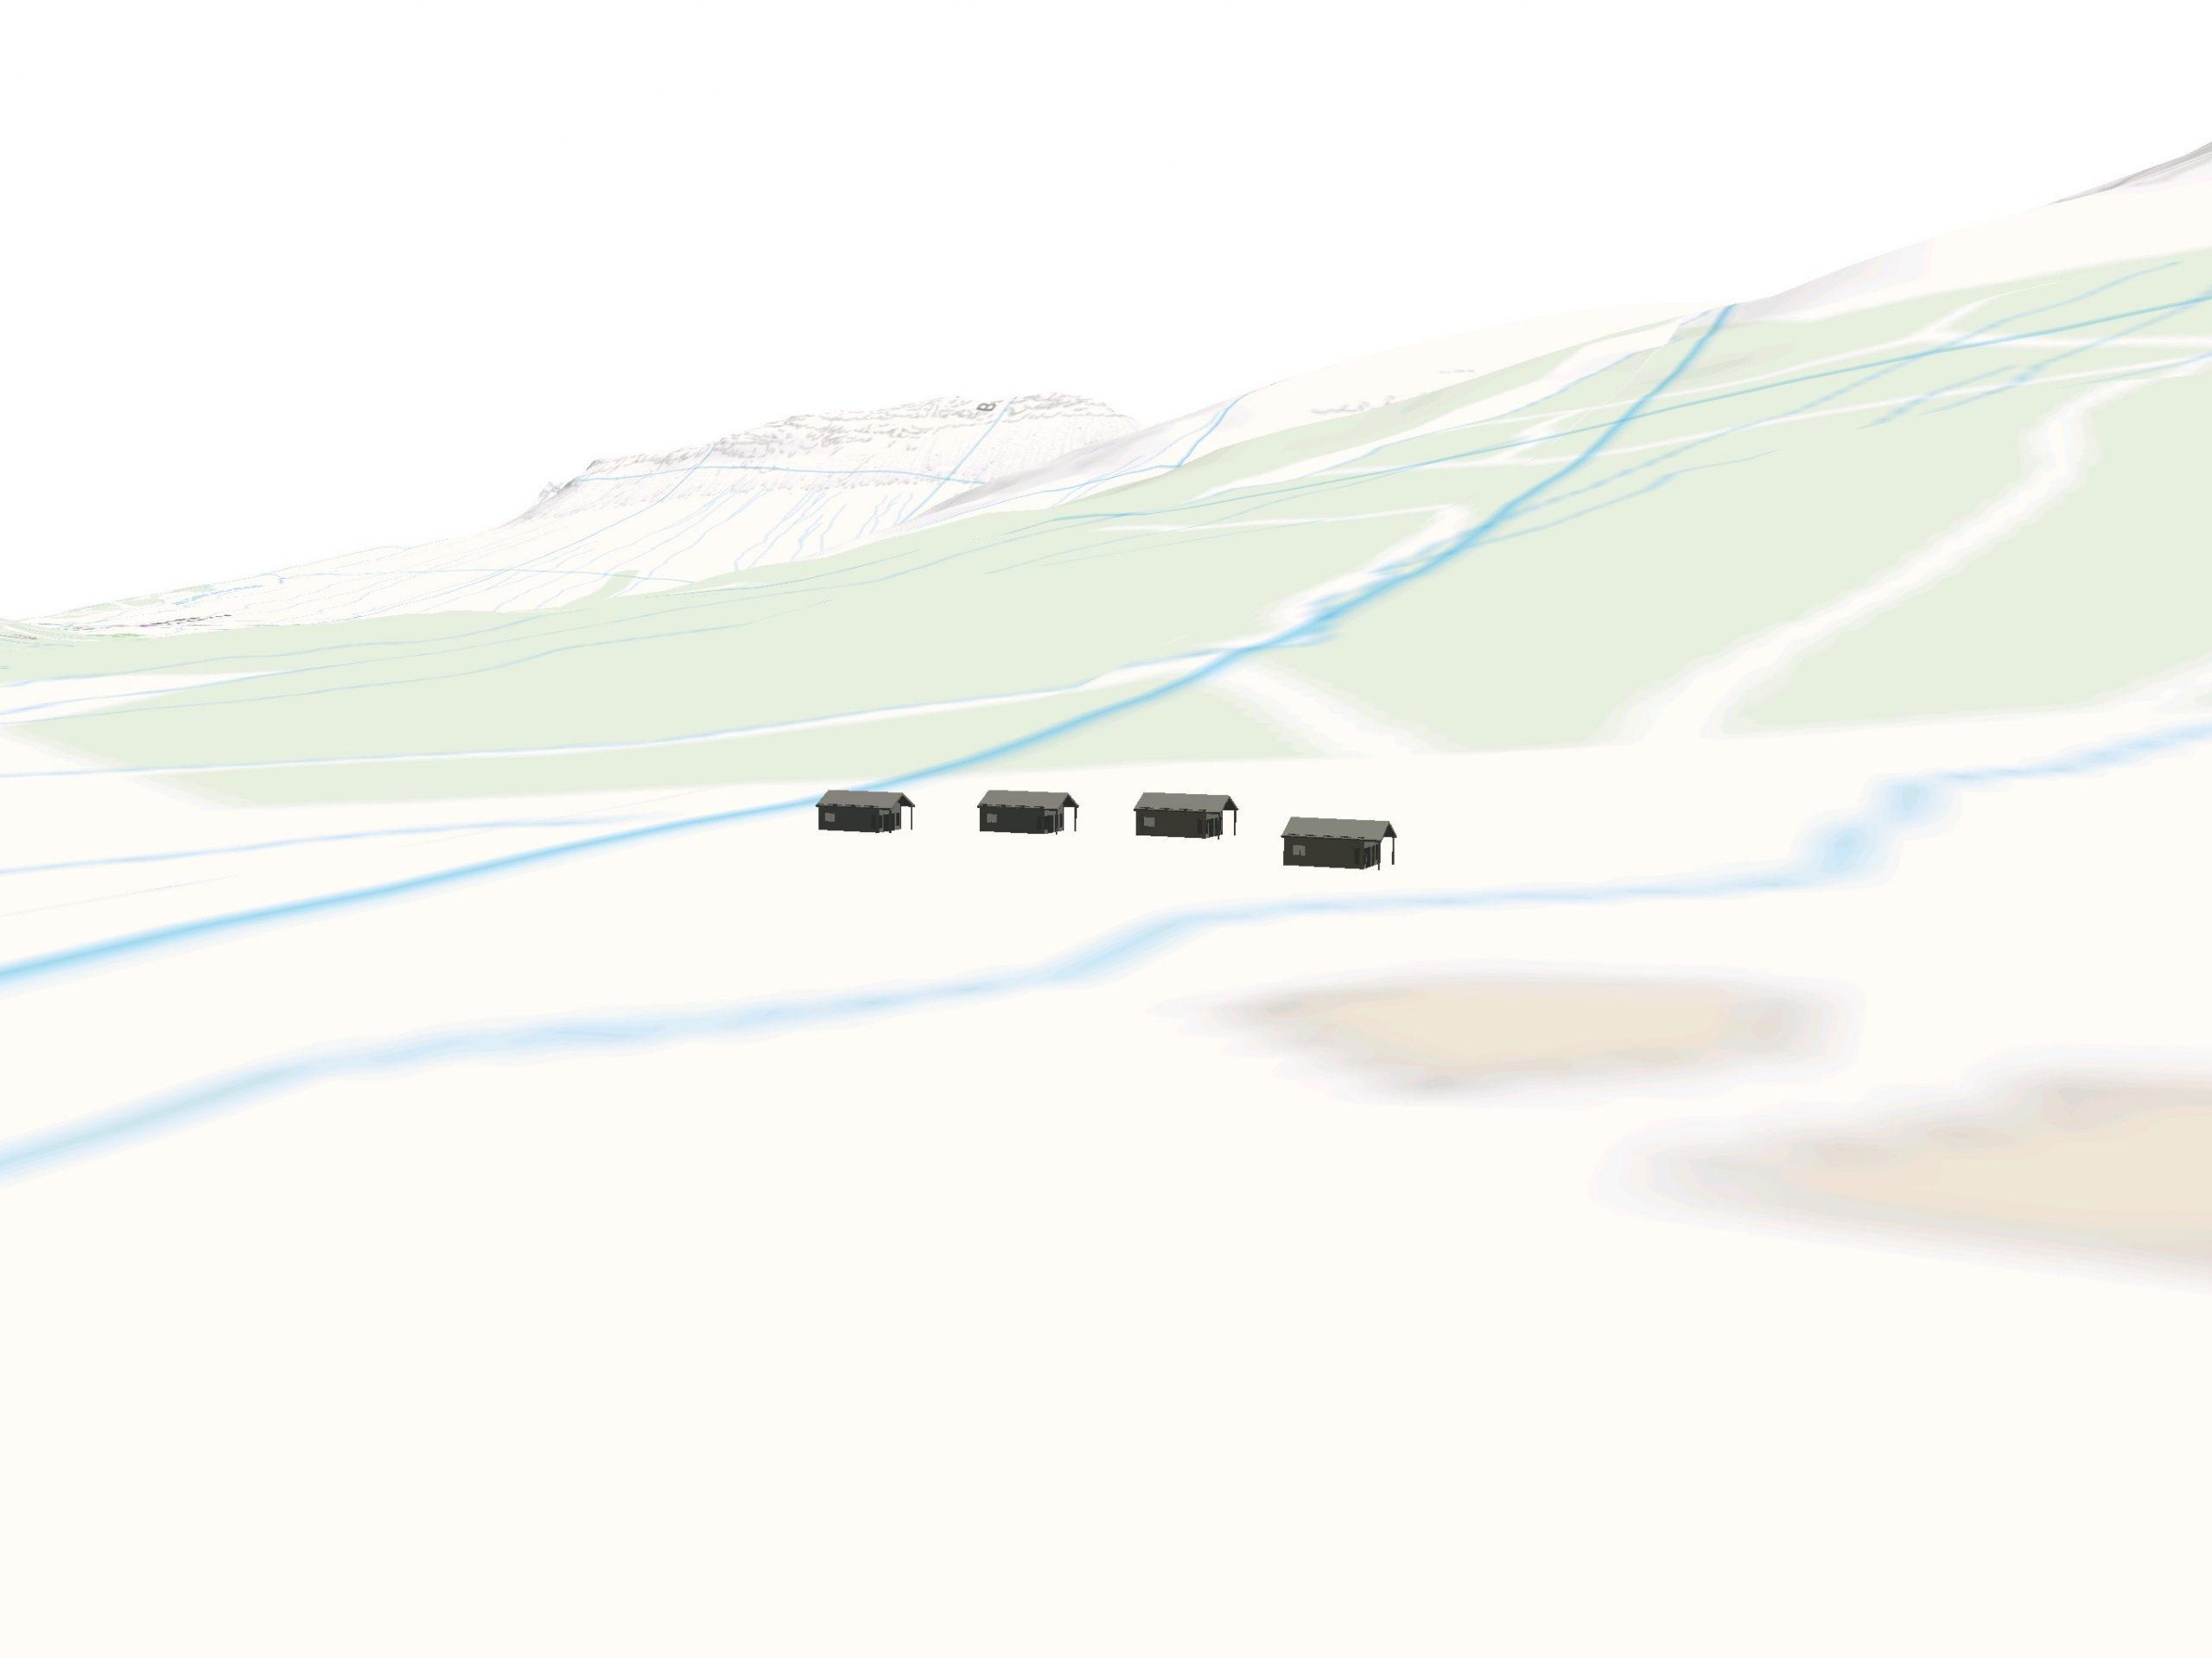
The Fly Through function of the app provides an overview of the terrain around a windfarm project. An example of the visualisations this can produce is shown below. This function works by:
- Loading an area of terrain from the TVV terrain server
- Optionally displaying an overlay loaded from the TVV mapping server
- Showing turbines at the correct location on the terrain surface as defined the portal.
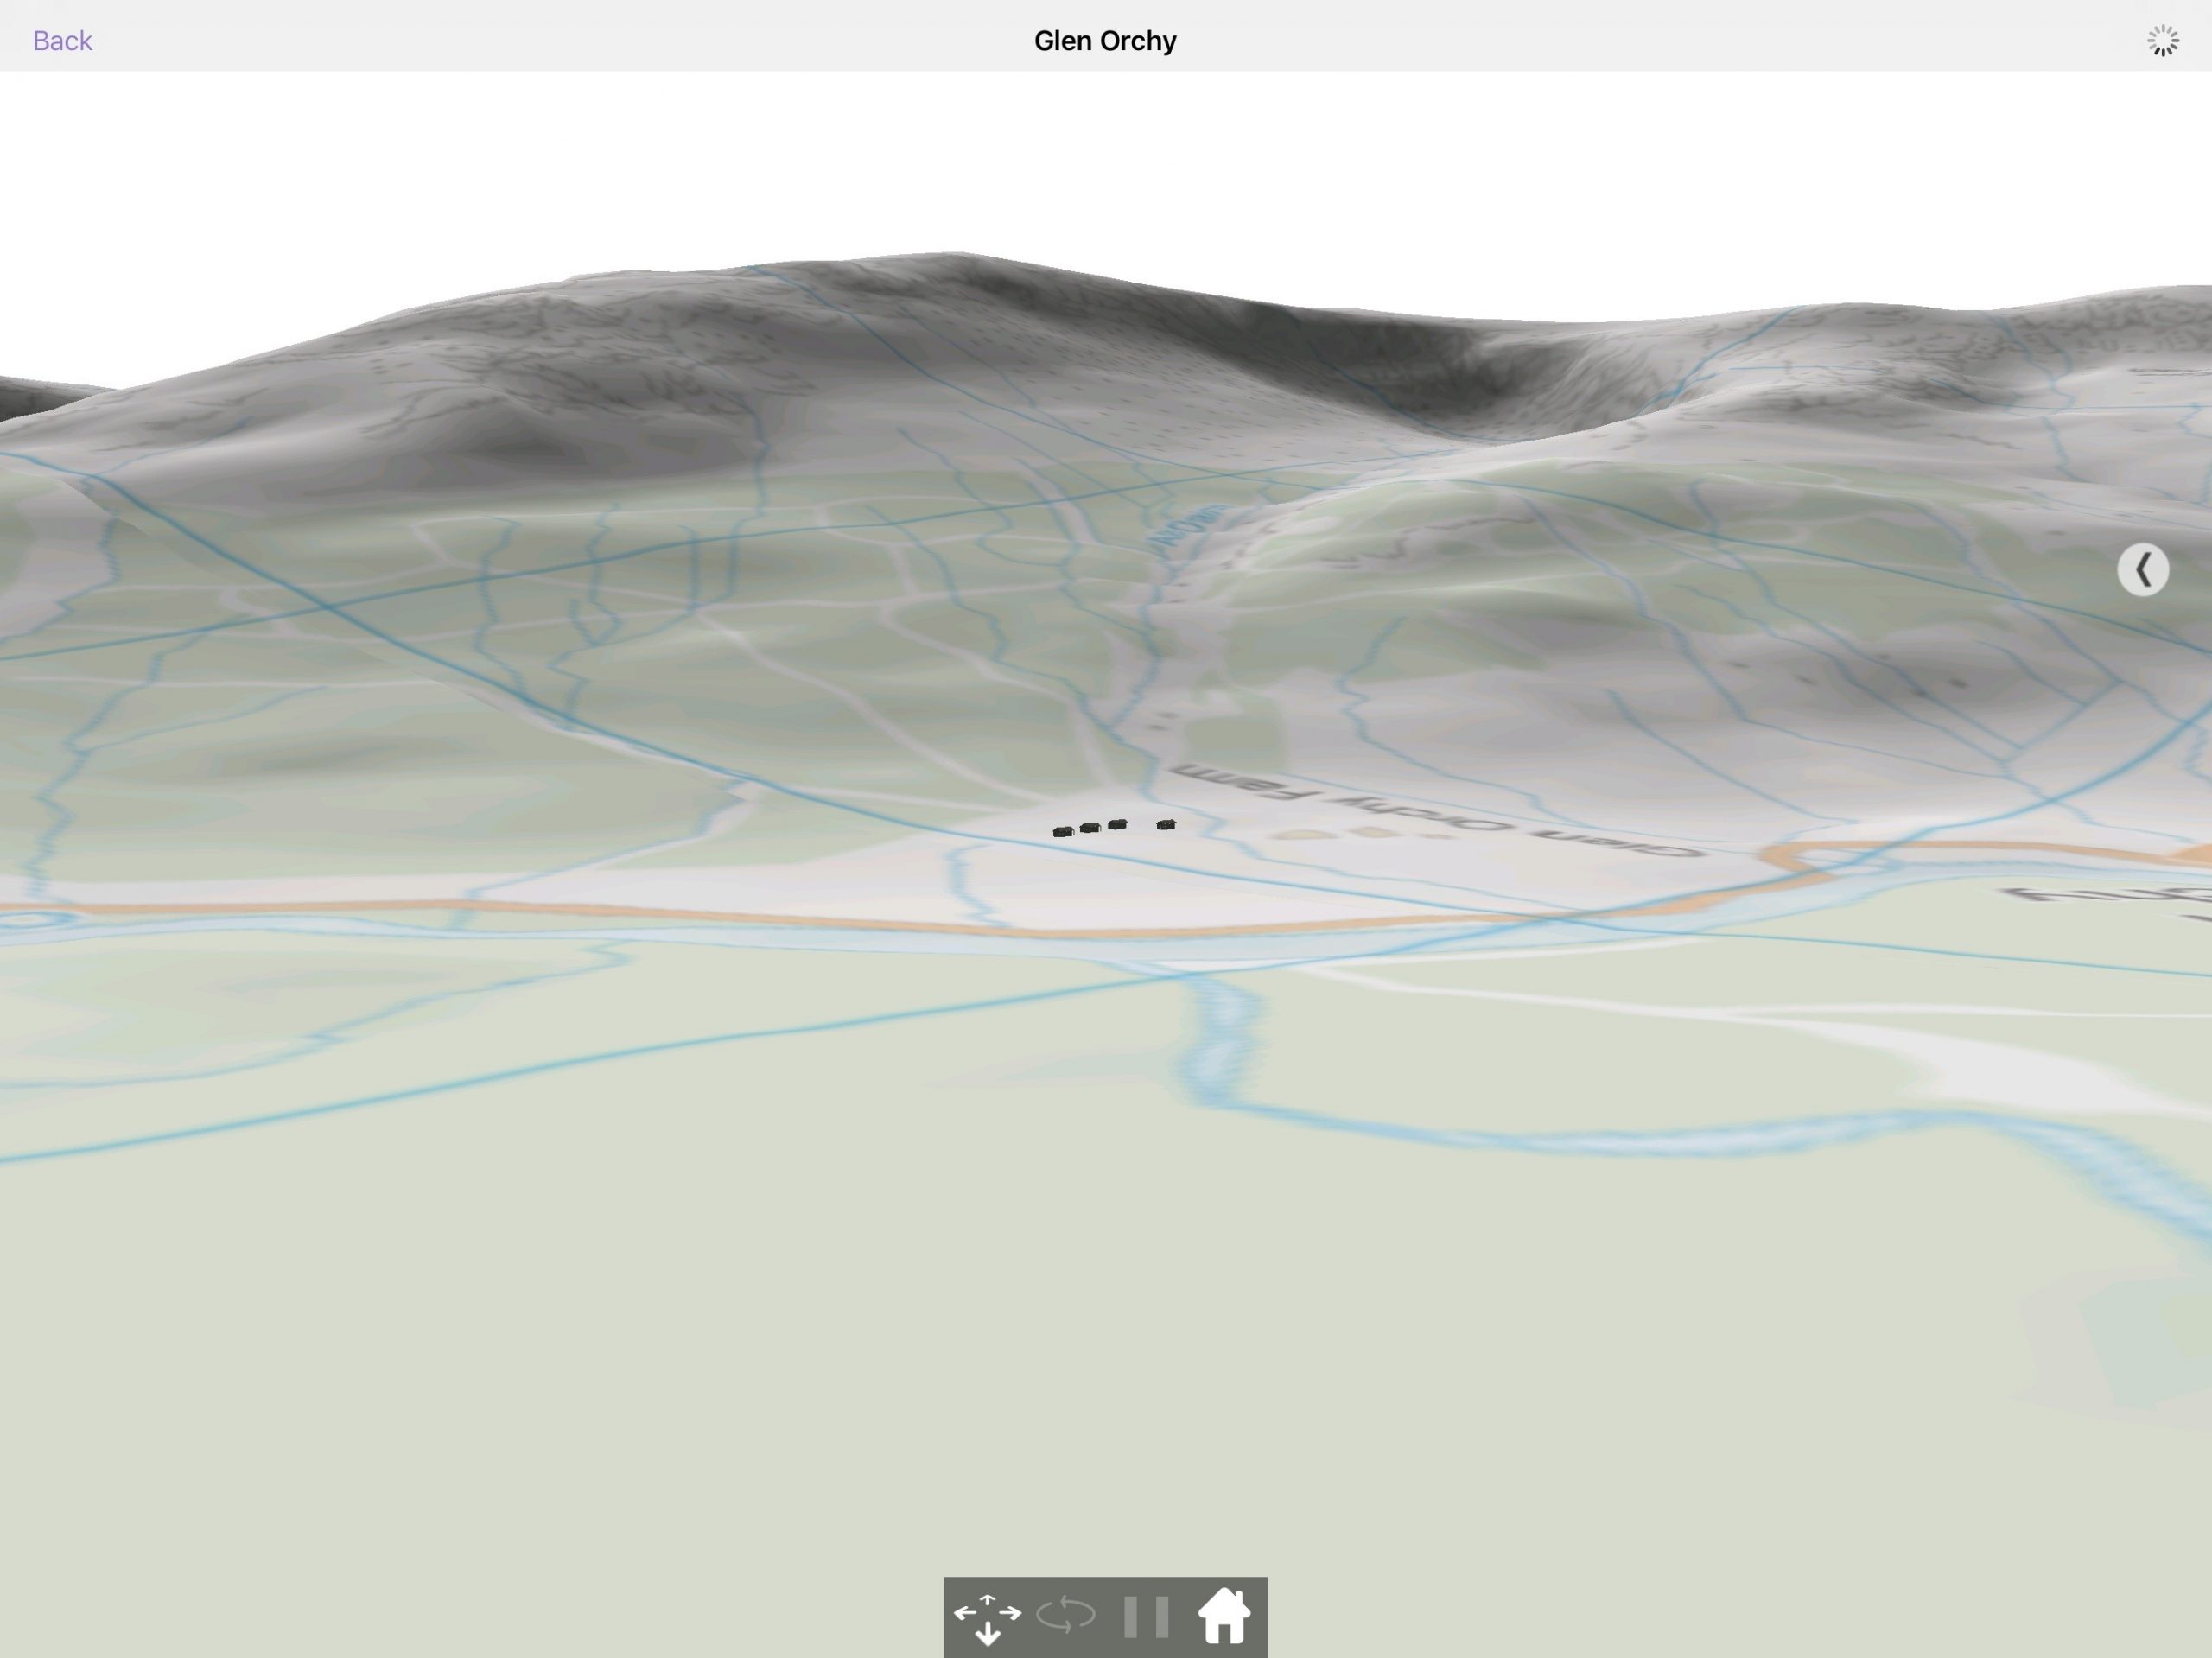
By default, Fly through uses vertical exaggeration to make the hills more visible, so it should not be used to view wirelines. It is designed as an overview tool to explain what the area around a project would look like.
Terrain data
The terrain services that are available to a certain project are defined in the portal. National coverage of Terrain 50 and Panorama is provided for all TVV users. Specific custom terrain data can be loaded into the Terrain Service if your organization has a license to use that data.
The terrain is divided into discrete blocks so in the example shown above, 9 blocks of terrain are loaded; where each block is a 10km by 10km square of terrain data.
If the device is online, TVV will download the terrain blocks when the Fly Through is launched. Once they are downloaded onto the device, they are cached so the device will not need to be online to view the visualisation. Terrain data can also be downloaded using the bulk download method described in section 3.3.
Overlays
An overlay can be shown on top of the terrain data. There are several default overlays that are available for all TVV users these include:
- Base Mapping –This is the Ordnance Survey’s Vector Map District product in Great Britain. For other geographies, we provide an extract from Open Street map
- Wirelines – This shows a grid with no overlay
- No Mapping – this shows no mapping over the terrain. The terrain is shown a default beige
Custom overlays can also be loaded into TVV GIS system. These are managed through the portal and any Raster files with an appropriate world file can be uploaded. The example shown above uses Ordnance Survey 1:50000 mapping raster files uploaded as GeoTiffs.
Fly Through controls
Buttons
The buttons used in the Fly Through are described below.
| Button | Location | Action | |
 | Top left | Returns to the previous page | |
 | Top right | Shows internet connection active | |
 | Middle Right | Expands the right-hand panel |
Control panel
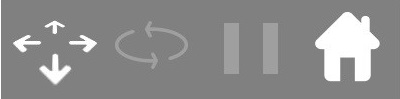
The Control Panel positioned in the middle at the bottom of the screen allows the user to navigate throughout the scene.
| Item | xxxx | Description |
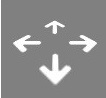 Pan | When this mode is active the user can change their viewing position by touching the screen and dragging in the desired direction of navigation. This mode is active when the icon is a solid white colour | |
 Rotate | When this mode is active, touch the screen and drag towards the relevant side. This will change the orientation of the scene to allow viewing from different angles. This mode is active when the icon is a solid white colour. Note: This mode can only be used when the sensor is active | |
 Pause | By activating Pause the scene will no longer respond to the device sensors and no further orientation changes will occur. This mode is active when the icon is a solid white colour. | |
 Home | When tapped the user will return to the starting point of the scene. |
Fly Through with right panel
The Fly Through contains a right panel that can be accessed using the arrow in the middle right of the screen. There is no left panel or context map in the fly through.
Wind and Building domains will show two tabs
The Solar and Grid domains will only show the View tab.
- View – used to show metadata information about the visualisation
- Wind / Building – additional controls for Wind and Building projects
View tab
Target location
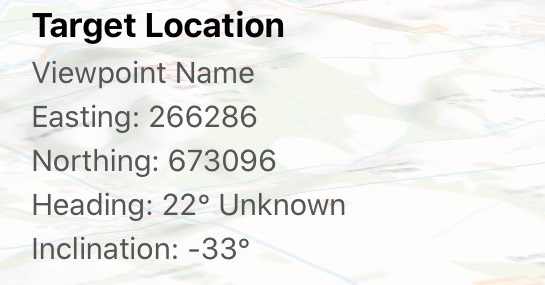
The target location metadata is shown in the right panel of the Fly Through visualisation is described in the table below. This metadata shows value and source (and where appropriate accuracy and any calibration that has been used)
| Metadata | xxx | Example | xxx | Description | |
| Easting / Northing | 266286 673096 | The location the visualisation has been created from | |||
| Heading | 22° | Heading shows the direction the tablet is facing. If Grid is shown, this refers to the north reference the device is currently using. Options are Grid, Mag or True depending on whether the convergence and declination transforms are enabled | |||
| Inclination | -33° | The inclination of the device. 0° is looking parallel to the ground |
Controls
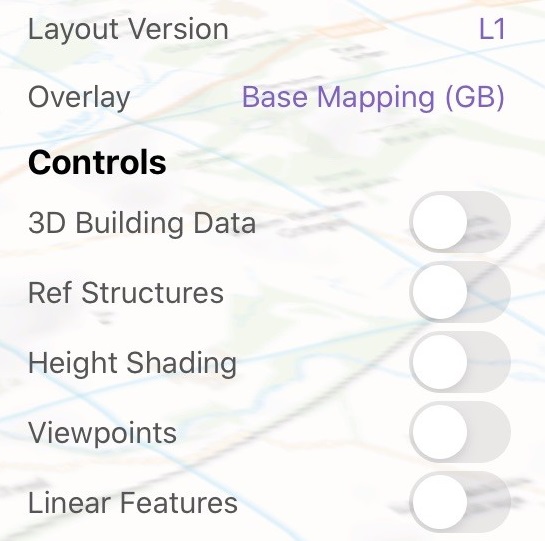
The controls used in the Fly Through right-hand panel are described in the table below.
| Control | Action |
| Layout version | Change the layout version |
| Overlay | Change the overlay |
| 3D Building Data | Switch to turn on and off 3D building data |
| Ref Structures | Switch to turn on and off the reference structures |
| Height Shading | Switch to show a height shaded topological map |
| Viewpoints | Switch to show the viewpoint locations |
| Linear Features | Switch to show the linear features |
3D Building data
When 3D Building data is turned on, data will be downloaded from both the Open Street Map and MapGuide services which allows TVV to create models based on the information to represent forest and building information in the area.

Fly Through lighting
By default the visualisation is generated using default lighting. This is simulating the sunlight coming from a set direction.
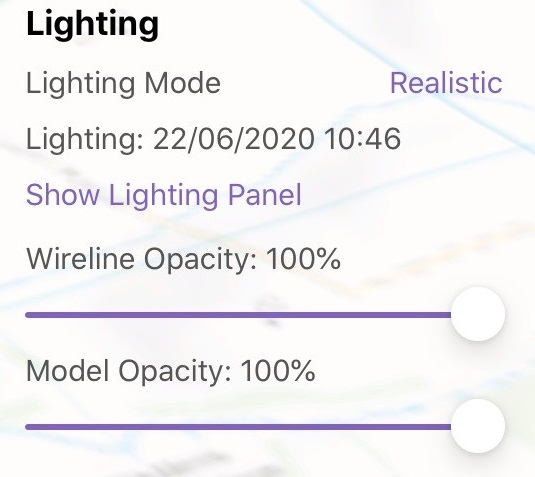
To enable real-world lighting, expand the lighting control panel by using the Show Lighting Panel. This will bring up a lighting control panel.
| Function | xxx | Example | xxx | Description |
| Lighting mode | Realistic / Ambient | Changes the lighting from realistic to ambient | ||
| Lighting: | 22/06/2020 12:28 | Shows the current date and time of the lighting | ||
| Show / Hide Lighting Panel | 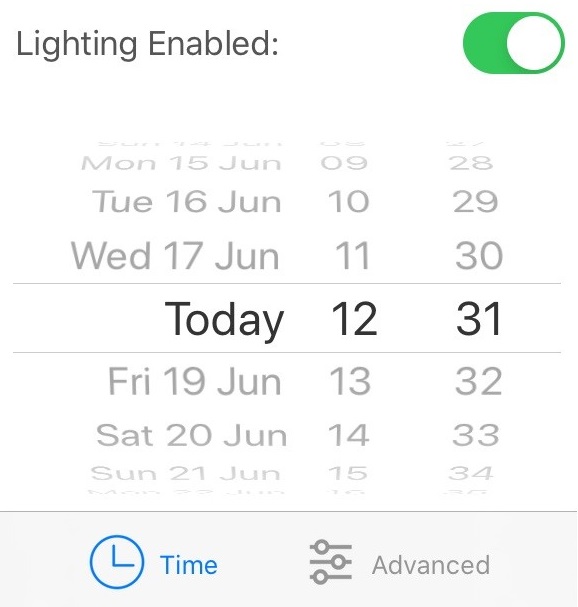 | Show the realistic lighting panel to allow lighting to be controlled. | ||
| Wireline Opacity | 100% | Adjusting the slider changes the transparency of the wireline where 0% is invisible and 100% is fully opaque | ||
| Model Opacity | 100% | Adjusting the slider changes the transparency of the models where 0% is invisible and 100% is fully opaque |
If real-world lighting is enabled in the lighting panel, that setting is stored and used for all subsequent visualisations. For example, turning real-world lighting on in the My View will mean that it is on in the Fly Through also.
Wind / Building tab
The Wind/Building tab provides options to allow the visualisation screen to be controlled.
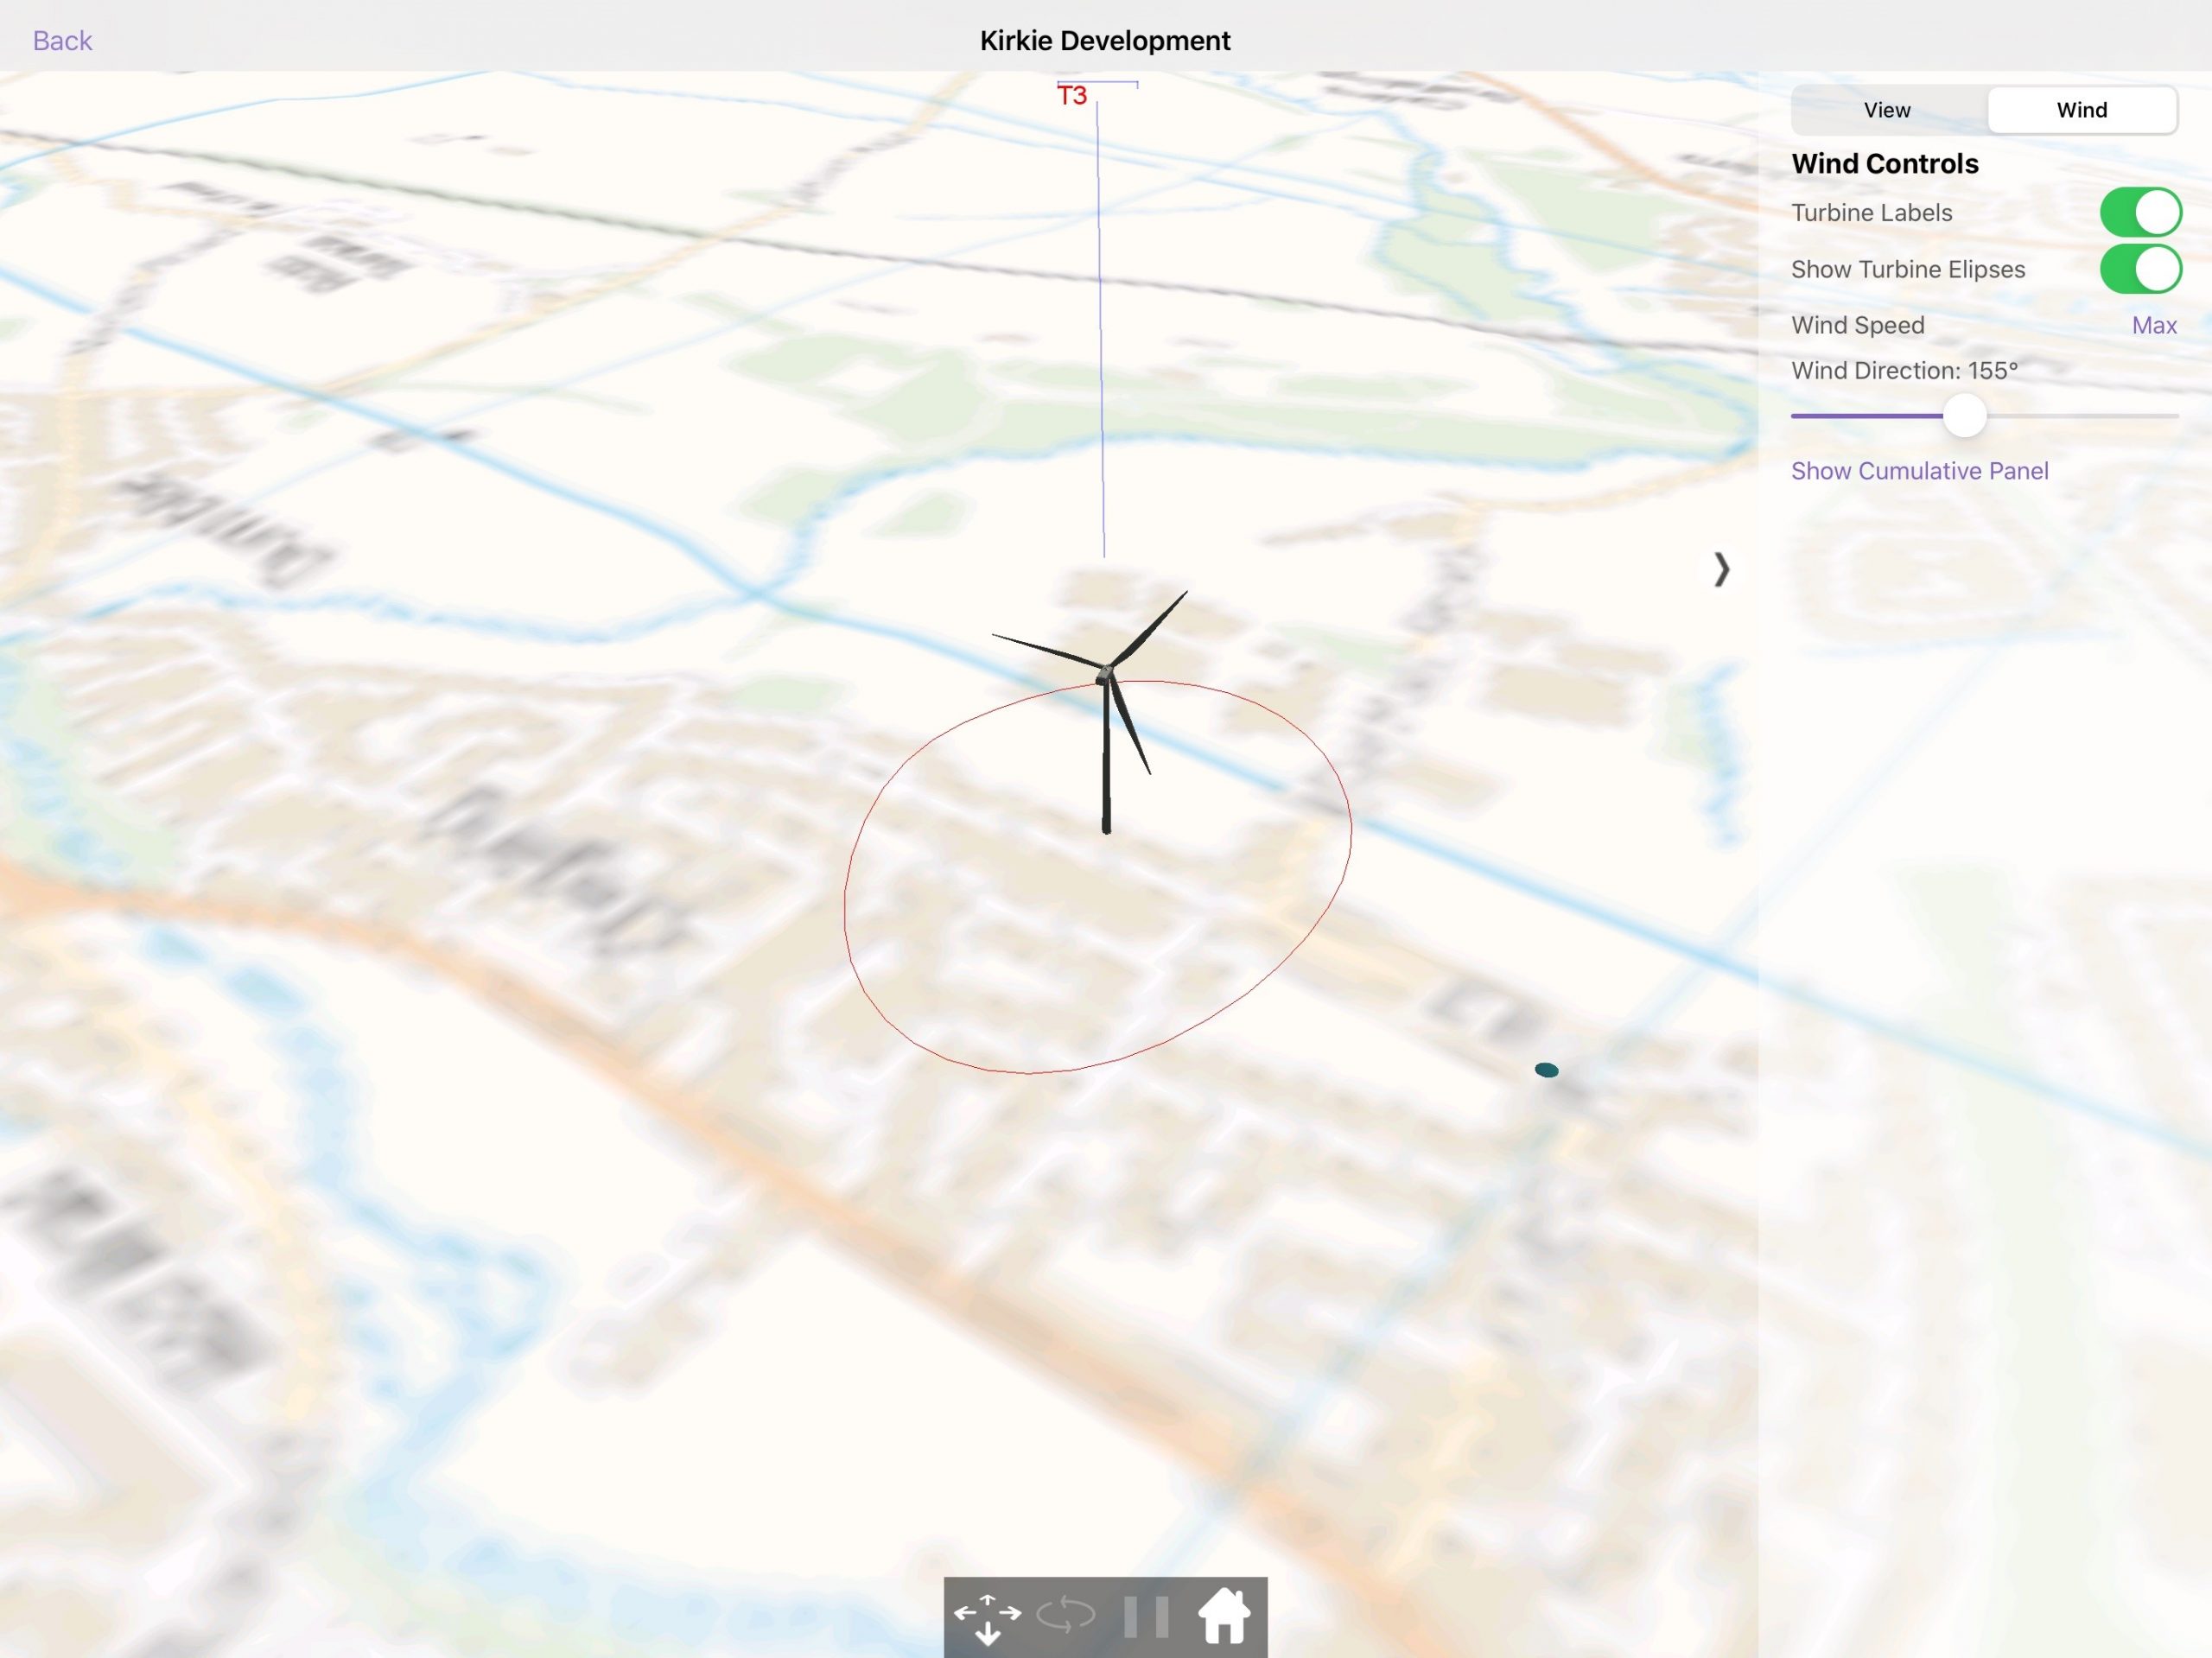
Wind controls
| Function | xxx | Action |
| Turbine Labels | Switches on and off the turbine labels | |
| Show Turbine Ellipses | Switches on and off the turbine ellipses | |
| Wind Speed | Controls wind speed based on max value property from the portal | |
| Wind Direction | Controls the direction the turbine blades face | |
| Show Cumulative Panel | Opens the Cumulative Panel |
Building controls
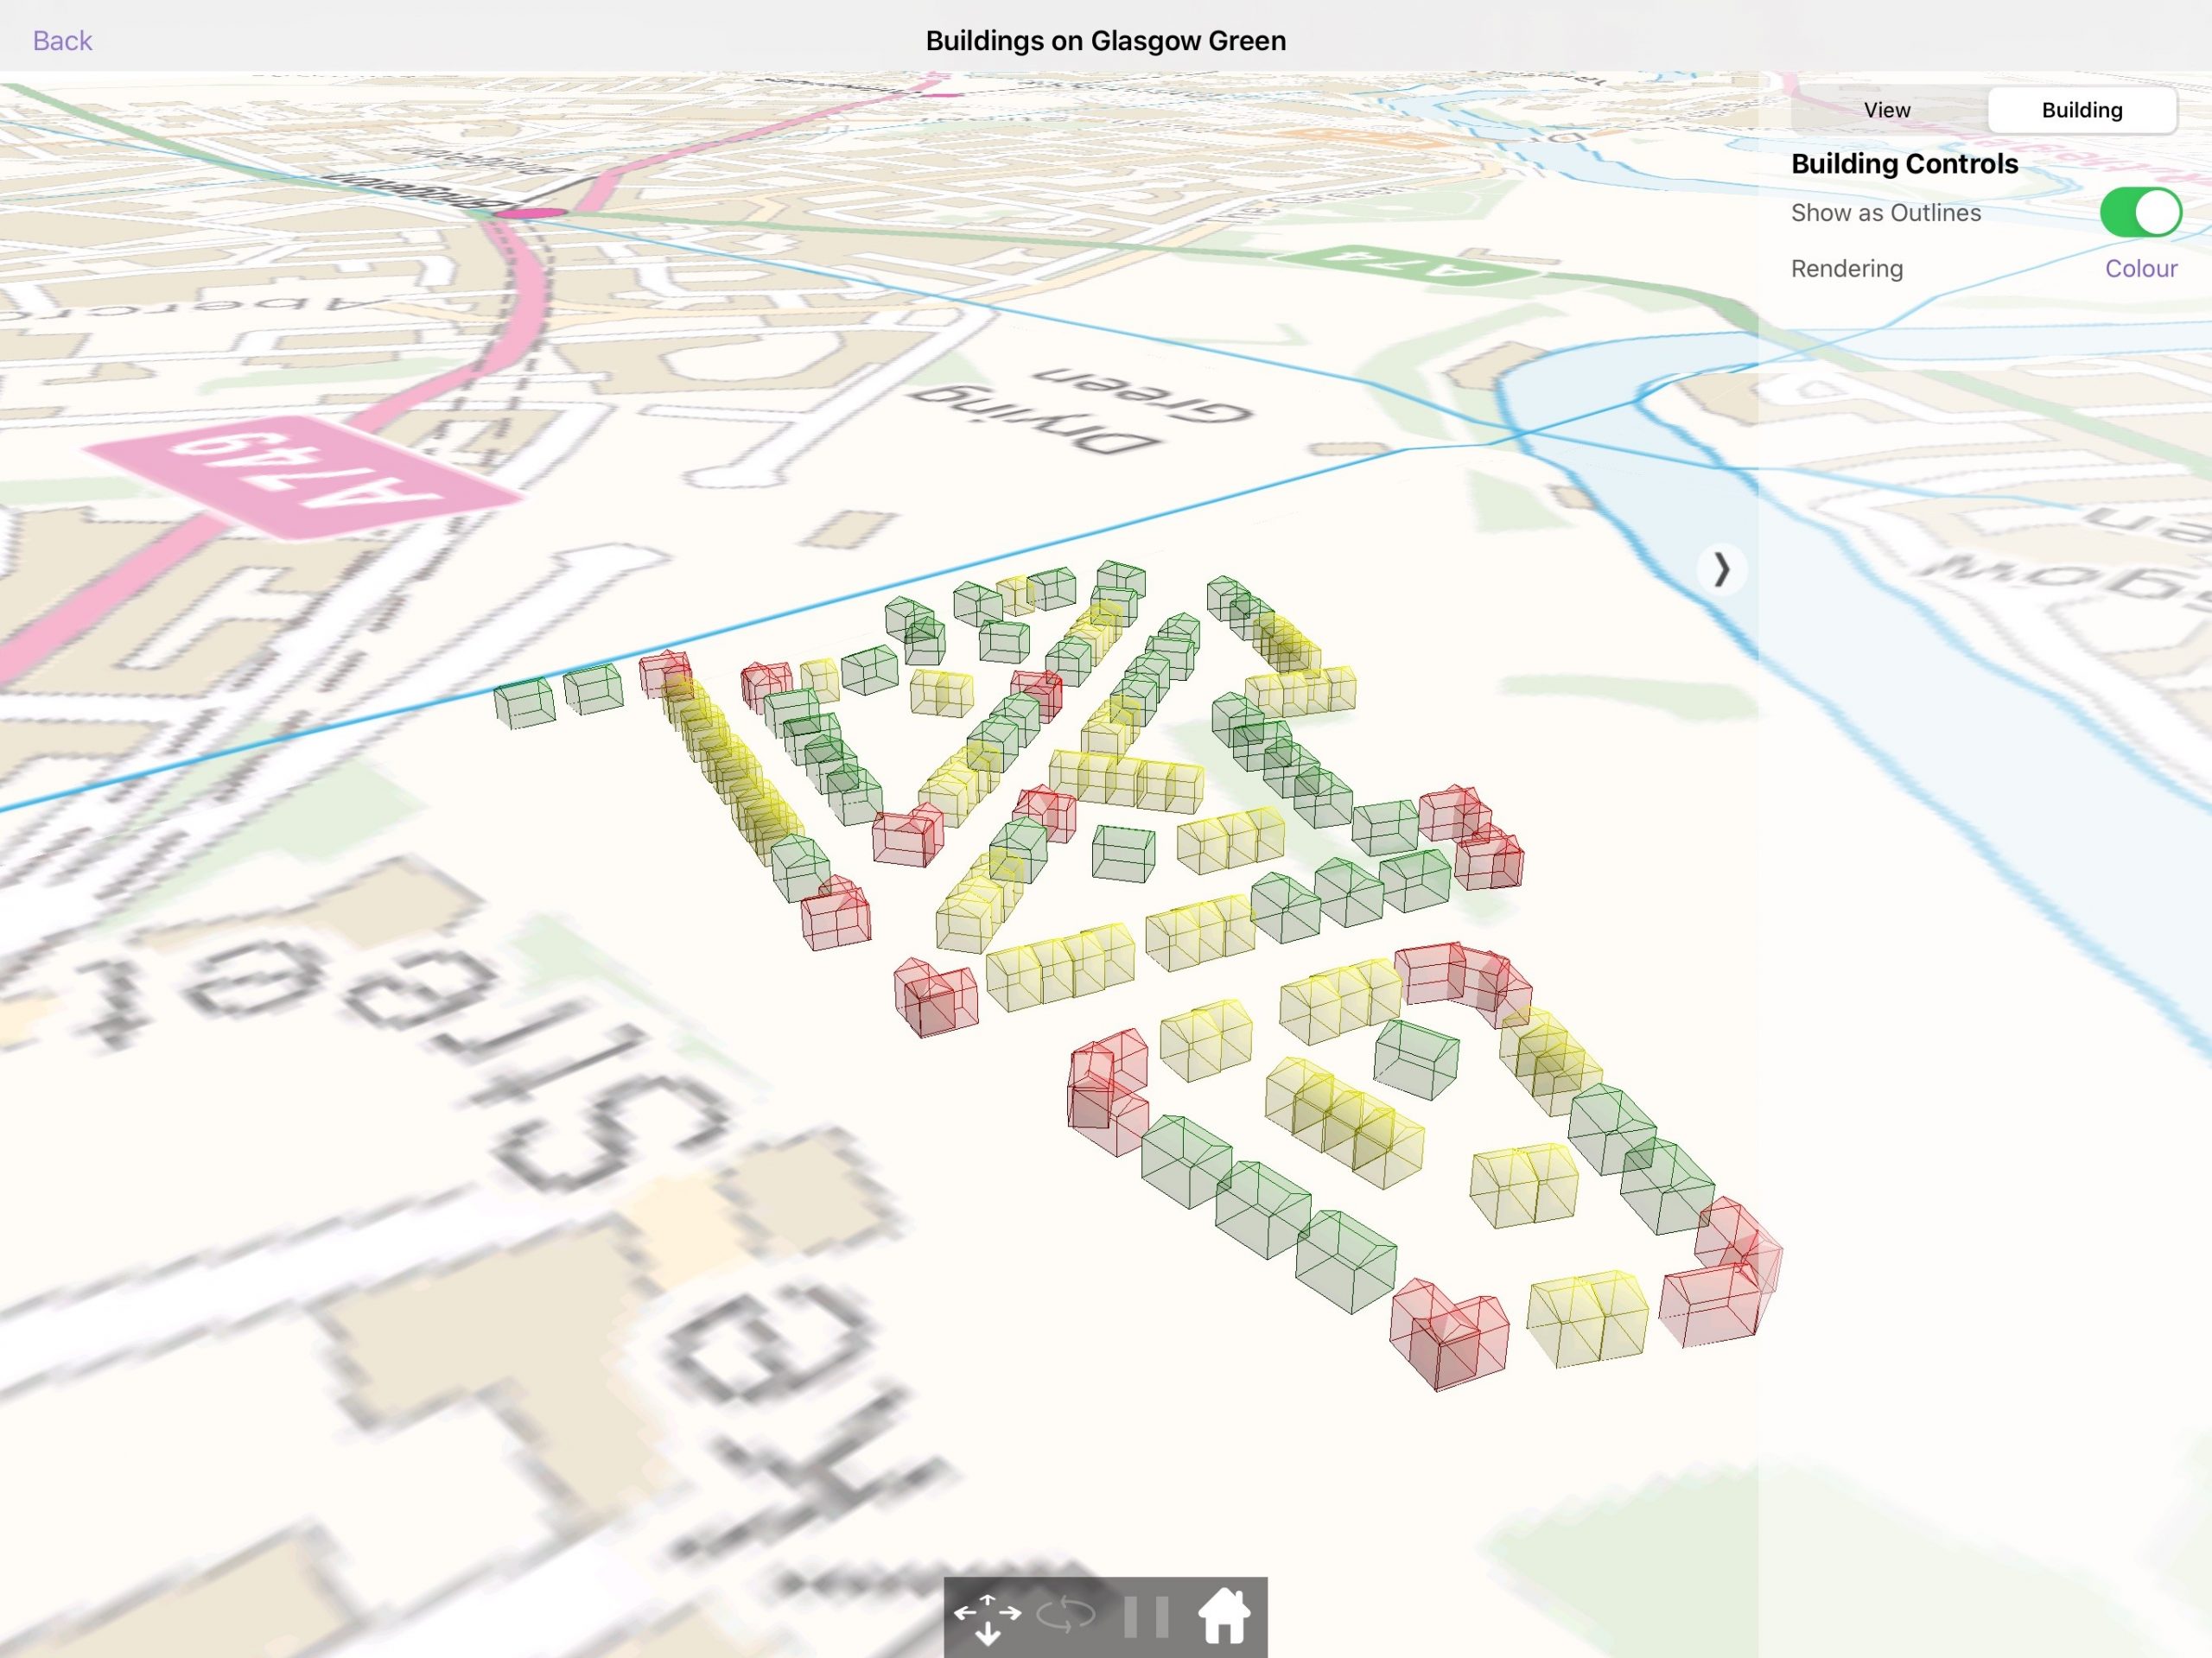
| Function | xxx | Action |
| Show as Outlines | Changes the model from solid to outlines | |
| Colour / Rendering | Changes the colour of the model |
Cumulative information
Across the top of Fly through, a bracket structure shows the location and spread of the cumulative projects. For single turbine projects, a single point is shown, for multi turbine projects the spread of the turbines is shown. An example is shown below.

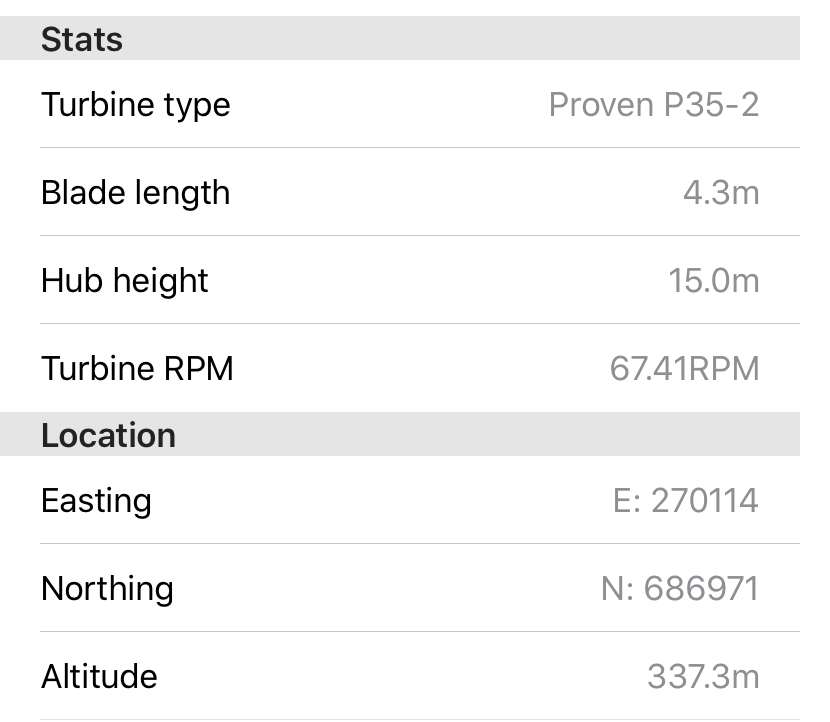
When a site name is tapped at the top of the screen more information about that site is brought up and shown in the bottom left corner.
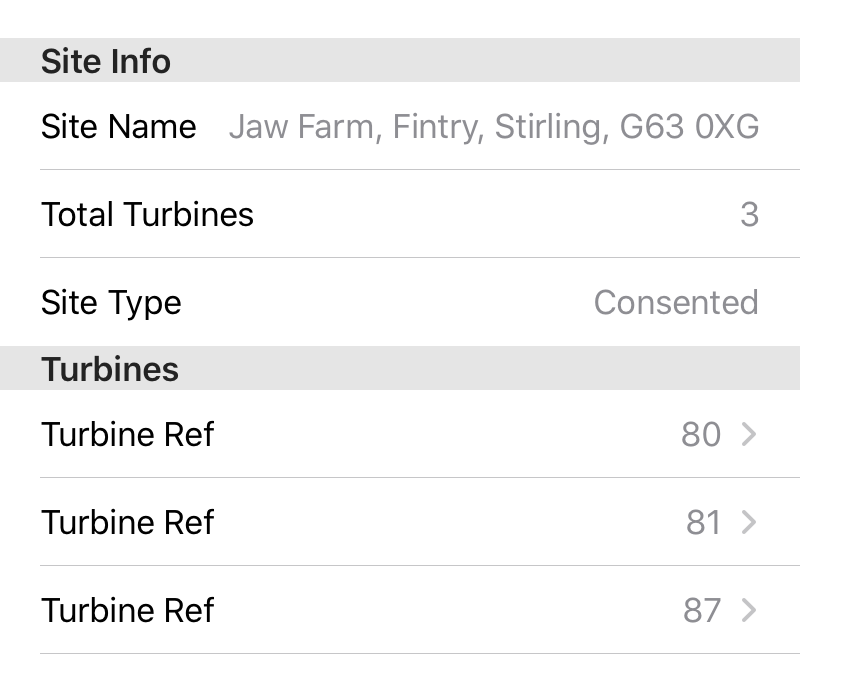
When a turbine from a cumulative project is tapped, more information about that turbine will be shown in the bottom left corner of the page.
User interaction – wind domain
Alterations to the existing turbine layout can be made in the Fly Through. The editing process works by:
- Tap on the turbine to open the turbine info panel
- Click the edit button (bottom of the turbine info panel) to open the Turbine Modification panel (shown in the bottom right corner of the screen)
The turbine can be moved in three different ways:
- Touch the new location you want the turbine on the terrain grid
- Drag the turbine to the location you want
- Nudge the turbine using the nudge buttons in the modification panel.
Click ‘Done’ in the turbine modification panel to save the changes.
| Item | Description |
| Easting / Northing | The location of the turbine in easting/northing coordinates |
| Altitude | The altitude of the turbine at its location |
| Copy | Copies this turbine and adds another turbine on to the terrain grid |
| Delete | Removes this turbine |
| Save | Finishes editing this turbine |
| Left, Right, Forward, Backwards | “Nudges” the turbine by 5m in the appropriate direction |
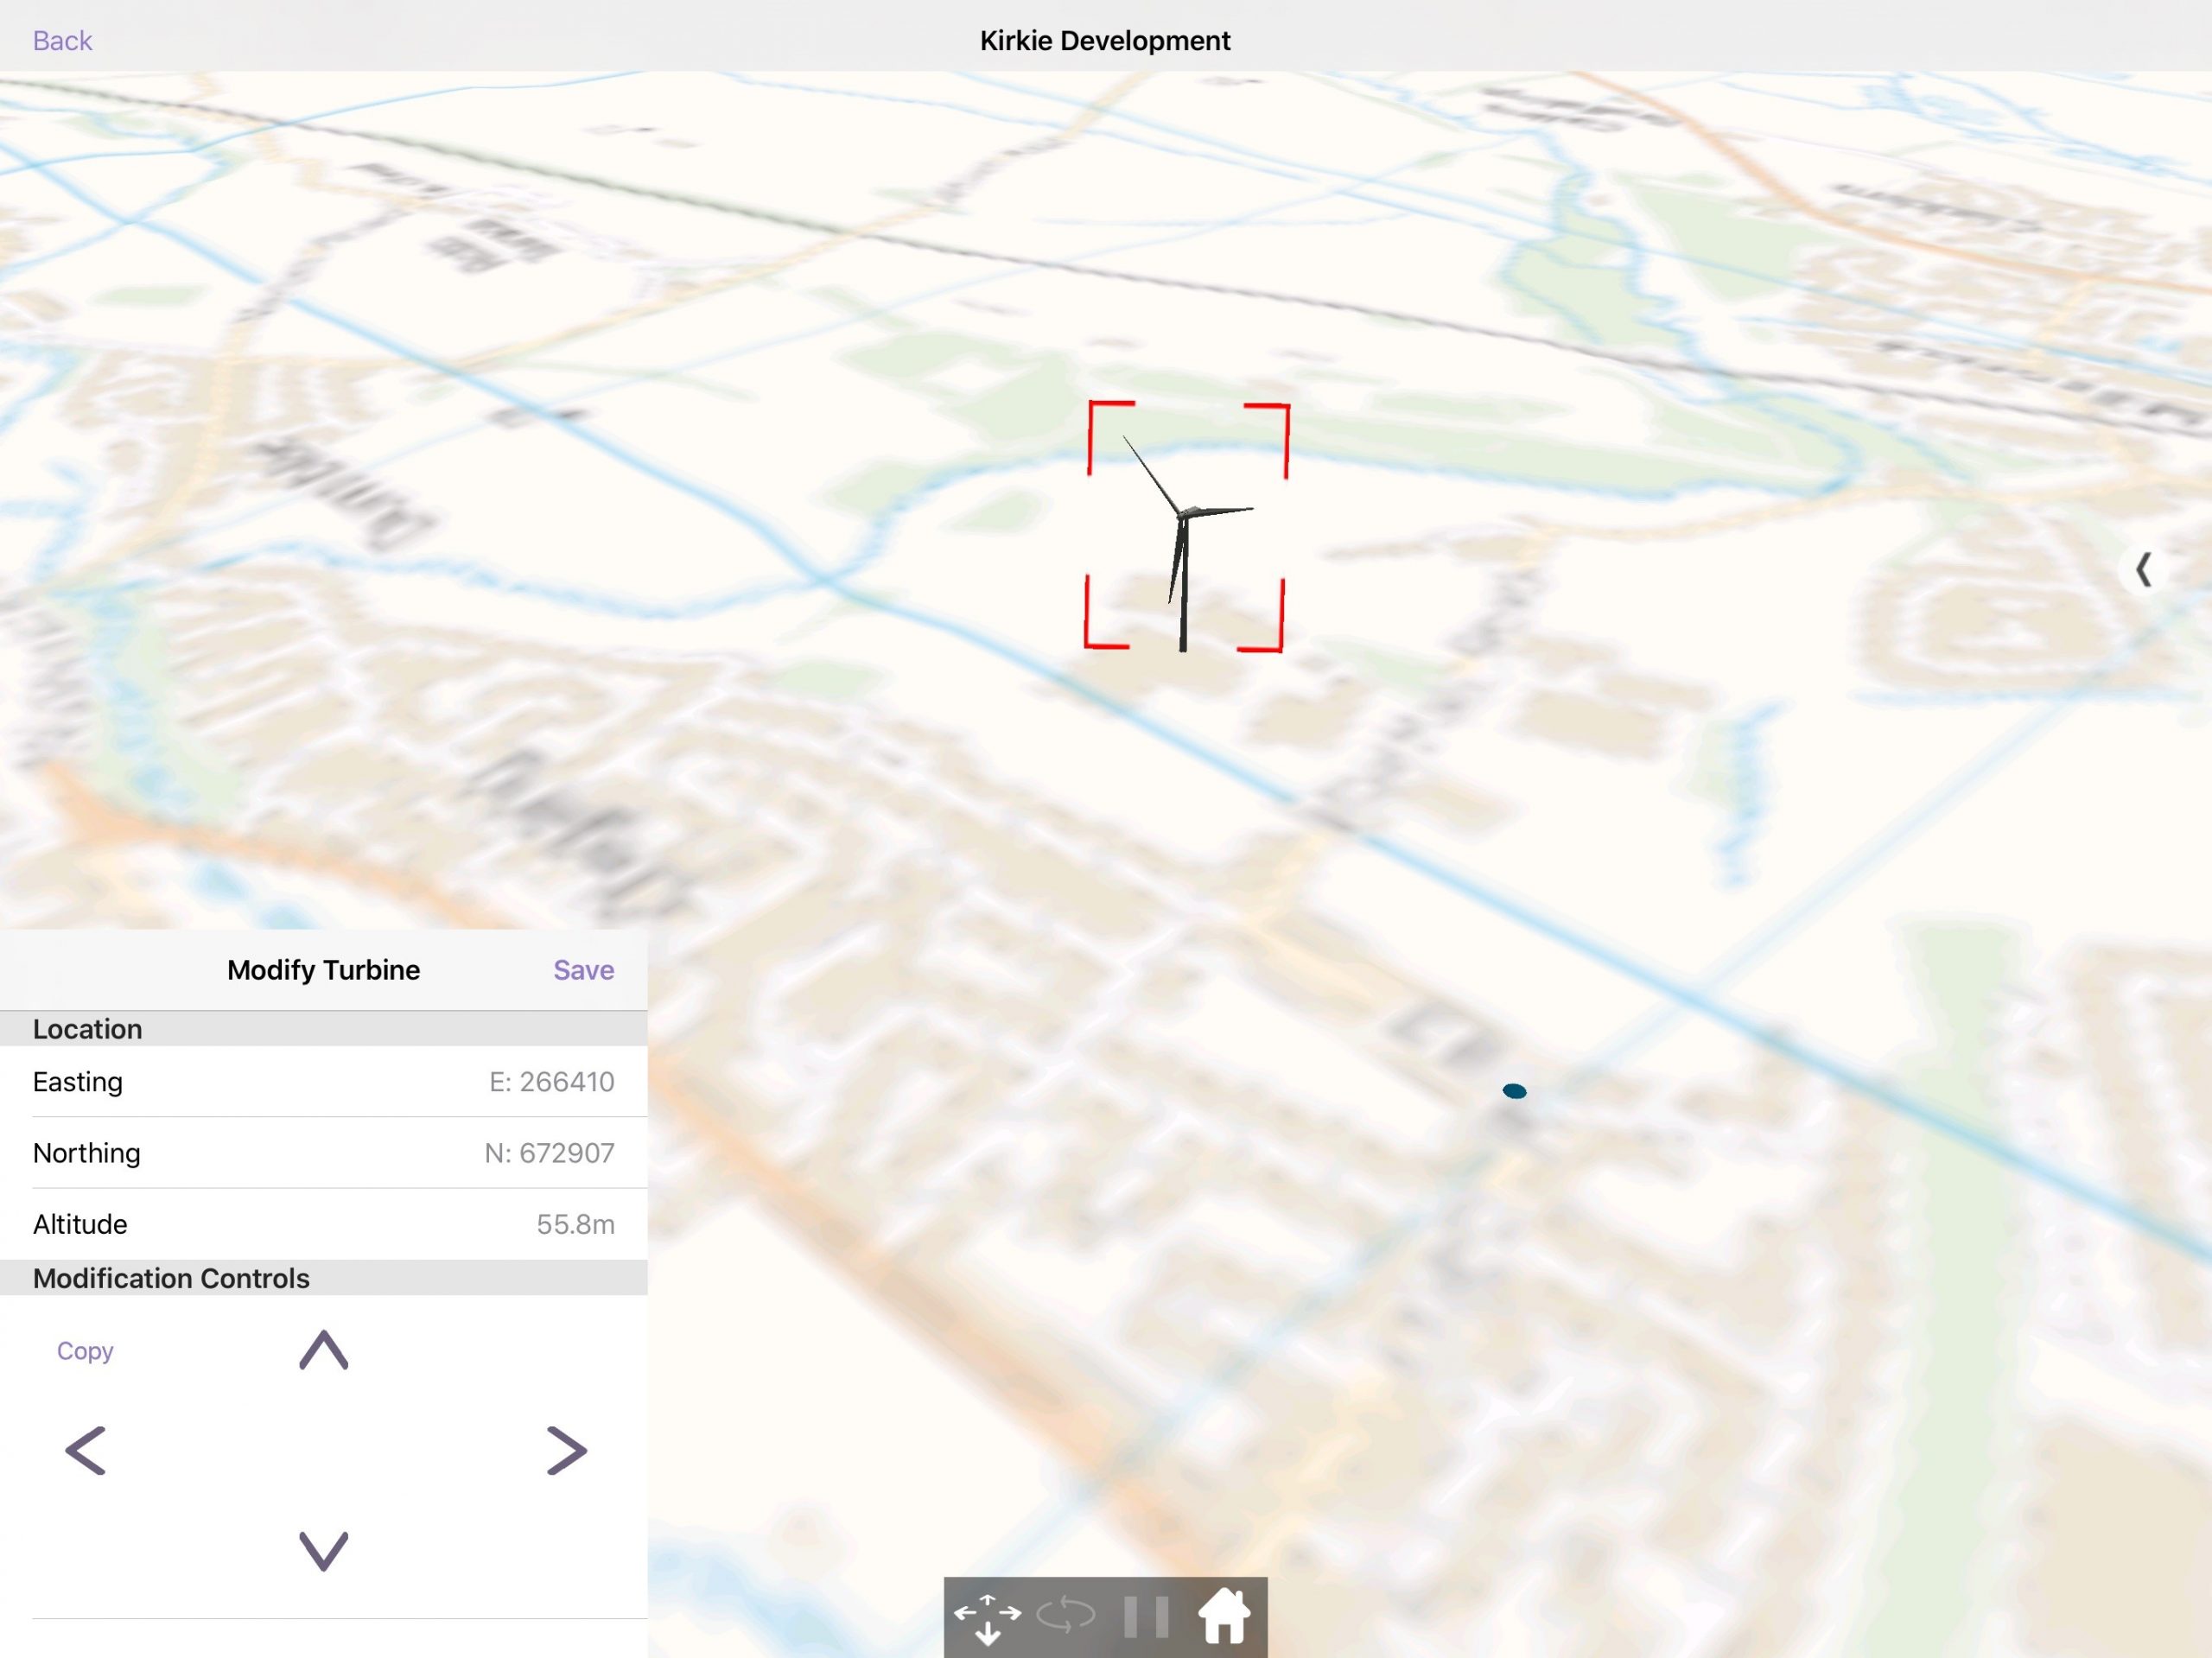
Once ‘Save’ has been clicked, a new layout version is saved on the device only. This is named + (modified). So when editing layout “1234” you will create “1234 (Modified)”.
An edited layout version can be deleted from the project details page.
Distraction-free mode
Enter distraction-free mode by double-tapping anywhere in the visualisation, this will hide all menus and just show the 3D visualisation.
To restore the menus simply double tap again.